1. Introduction
The original and popular Chartmaker extension has been in use by AI2 developers for years, and has provided a quick method to generate simple charts for pie, bar or line.
This extension is a complete rewrite of the original, builds on what was there, and offers many new features:
- two new charts: column and table
- a boolean to turn zoom on and off
- exposes the ability to add other options
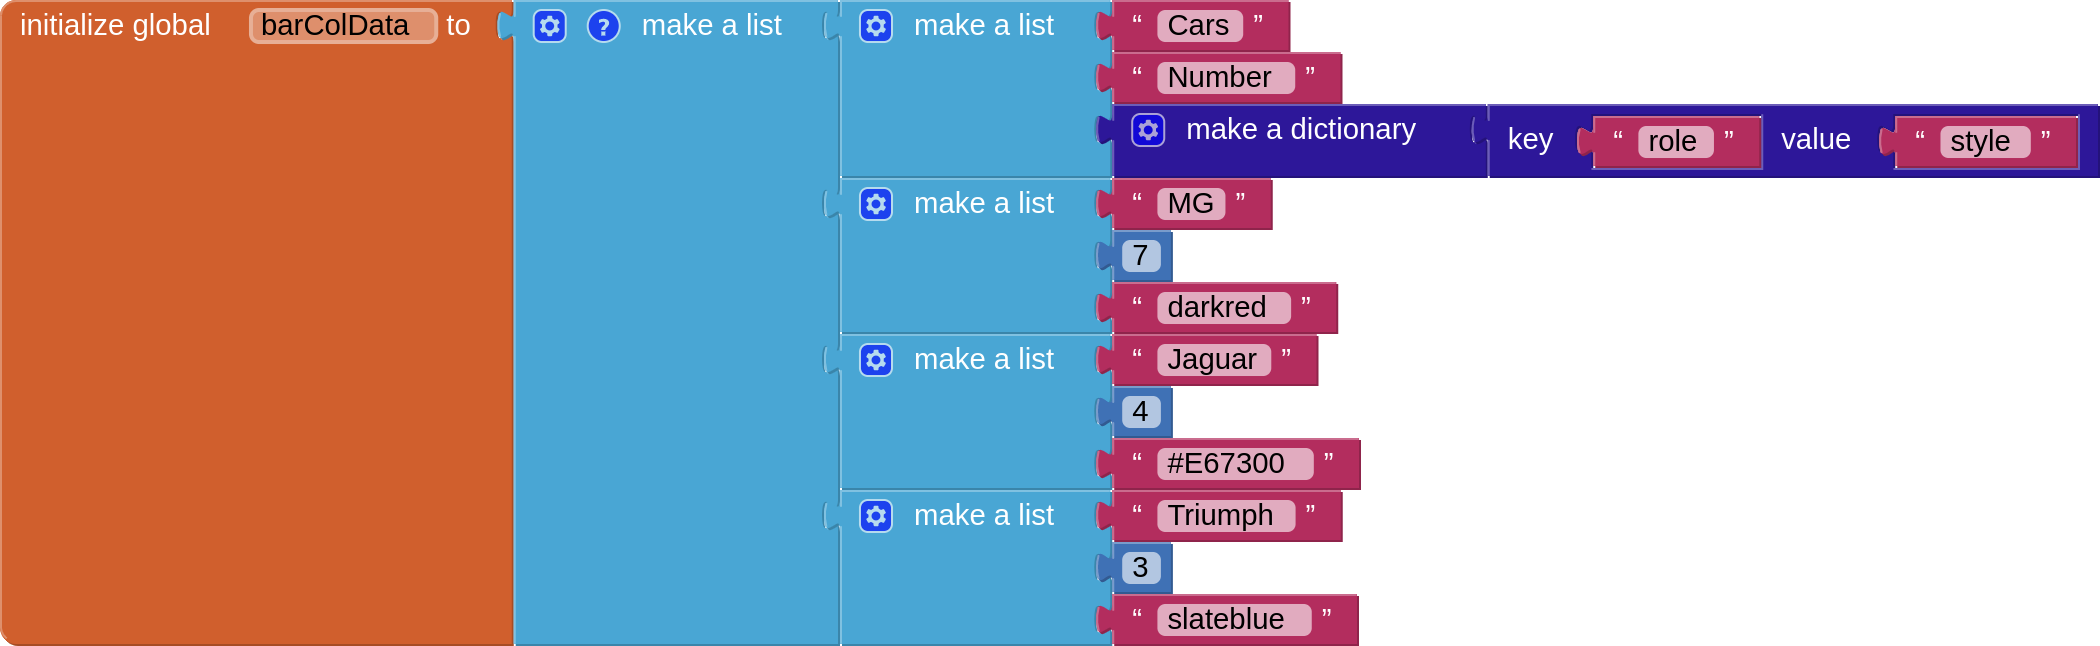
- simplifies data compilation - straightforward and user-friendly lists of lists
- returns selected data to the app through the webviewstring
- works with the custom webview extension
- multi bar and column charts now possible
- under the hood, deletes the chart html once chart is rendered
The extension uses "classic" google charts, the material charts on offer are less featureful.
- Latest Version: 4.0
- Tested: This has been tested on App Inventor 2 using Android 10 and 13 devices, companion 2.69, and compiled apk. It may work on other derivatives....
- Released: 2021-07-02T23:00:00Z
- Last Updated:2024-02-16T00:00:00Z
- Built: Using the Rush Extension Builder by @shreyash
2. Blocks
Please note there was a small update with V3 with the addition of a css socket to all the chart types (there already was one for the Table Chart)
3. Usage
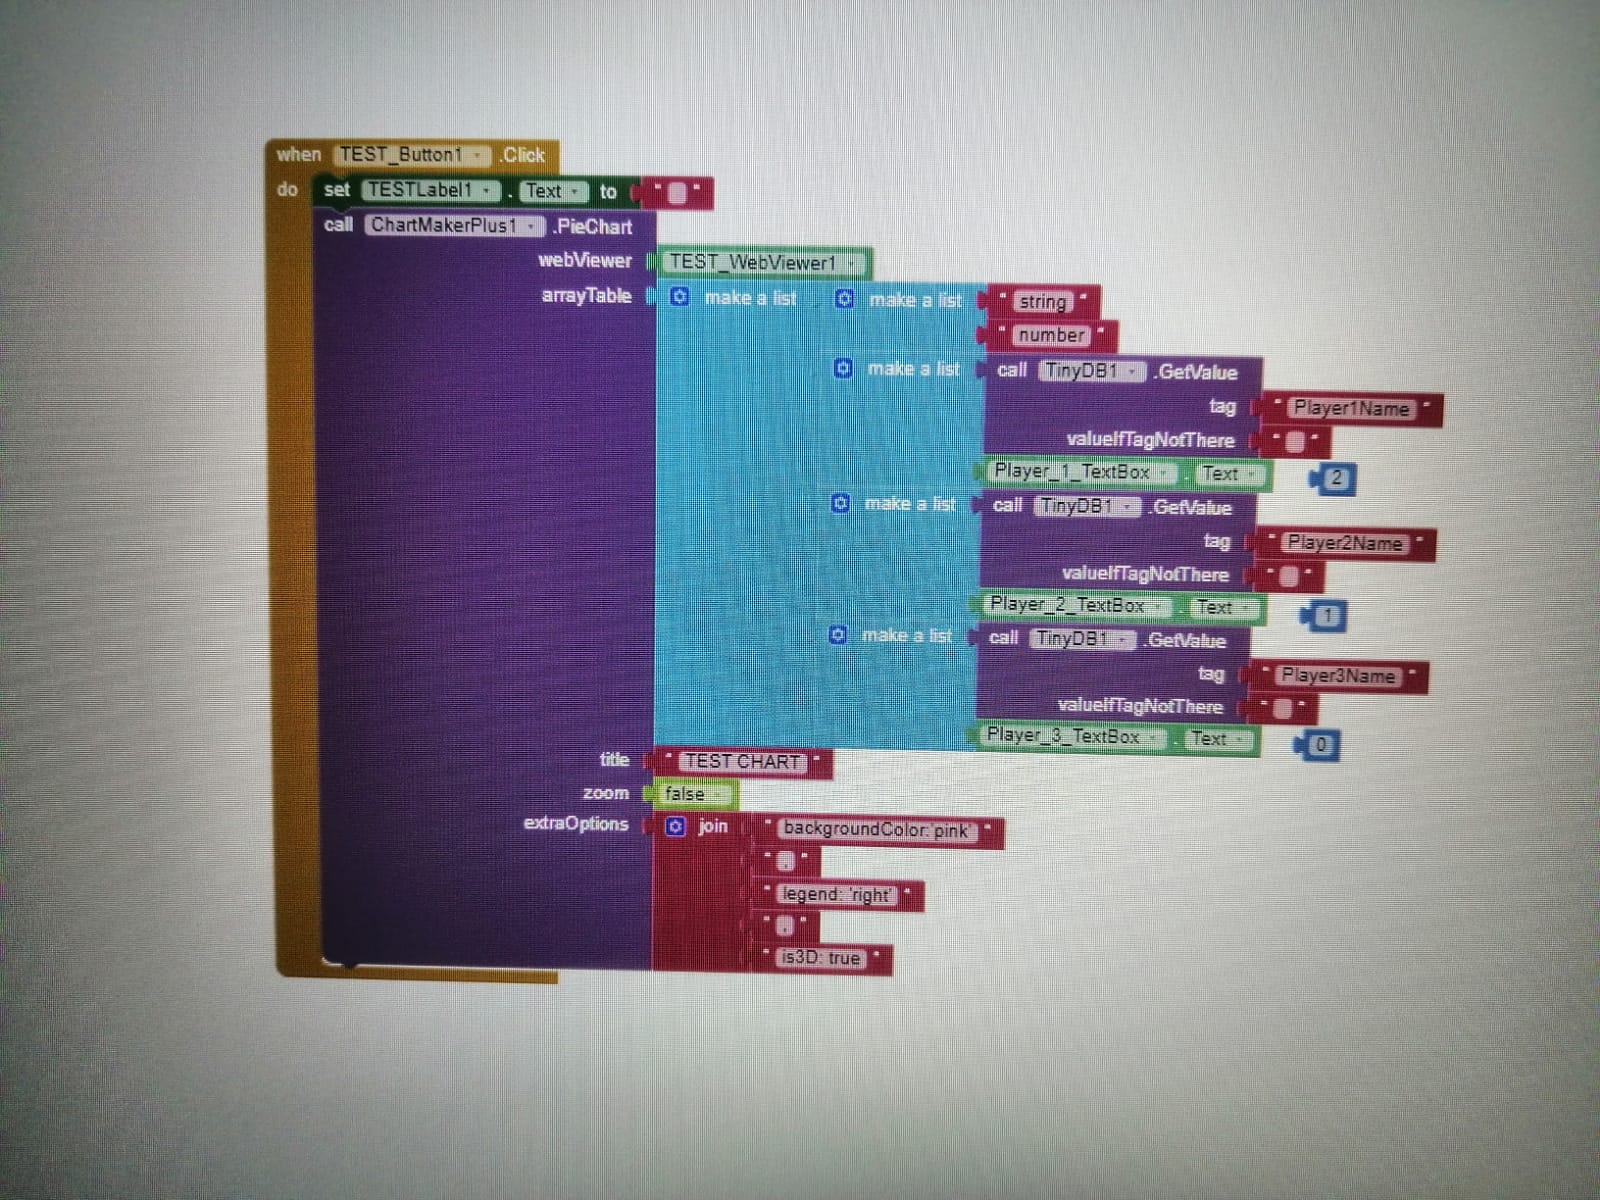
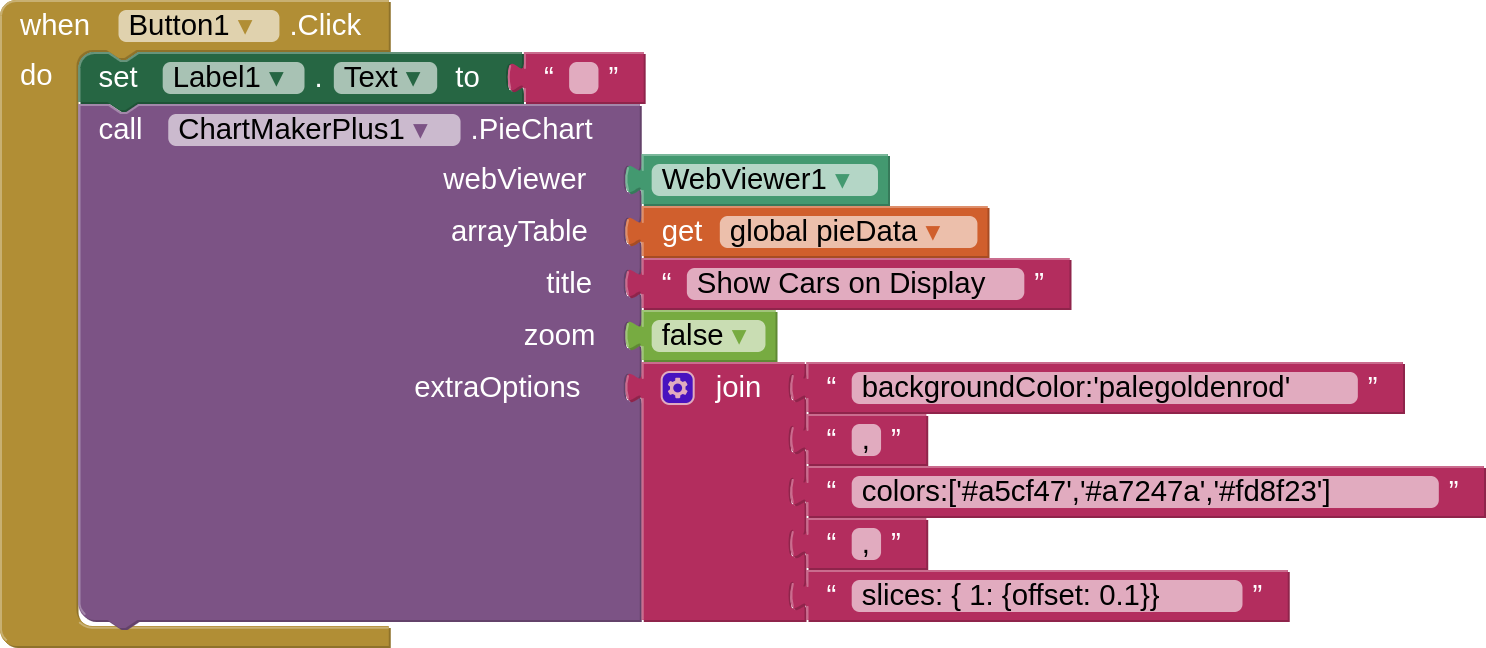
I could write a book about how you might use this, the configuration options for google charts appear to be endless (which is why Mills College did such a good job of keeping it simple!). In essence all chart blocks require a webviewer, a data table, and a selection for whether the user wants the chart to zoom on the screen when dragged (the plus and minus zoom buttons). After that it is about configuration. For each chart I have shown a few ideas of what can be done, and provided a link to the specific documentation for each chart. Syntax is important.
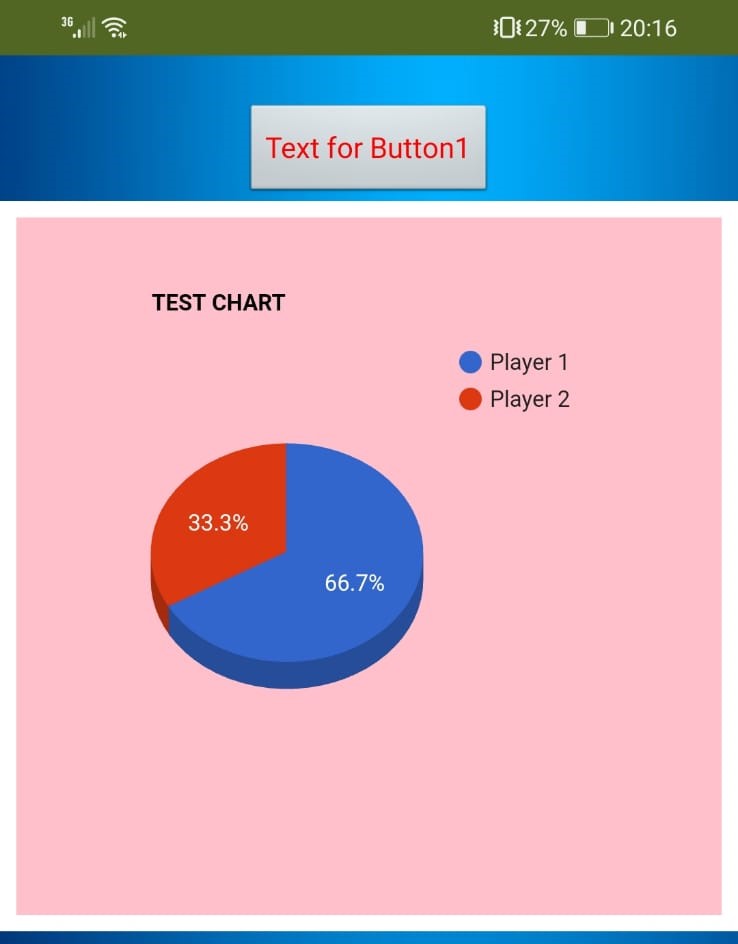
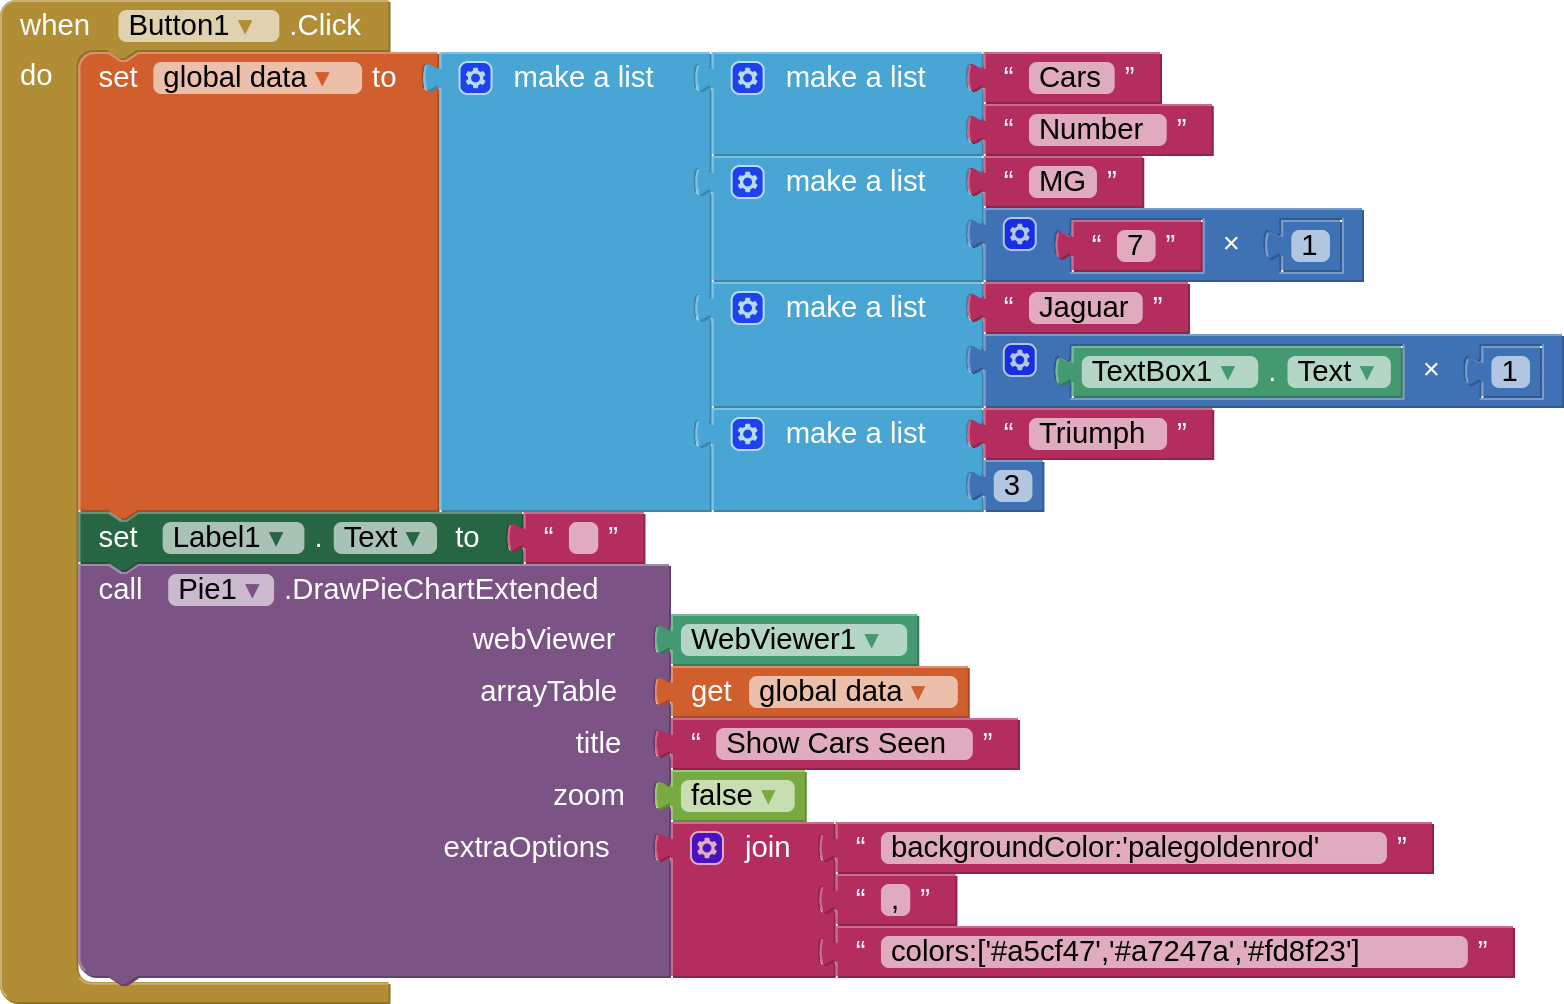
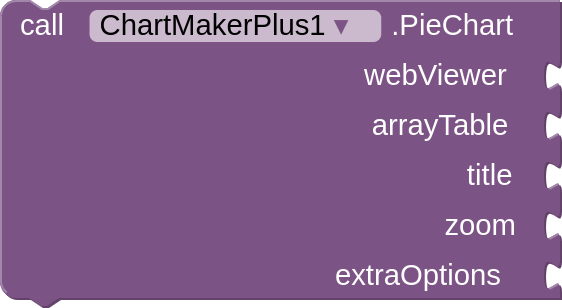
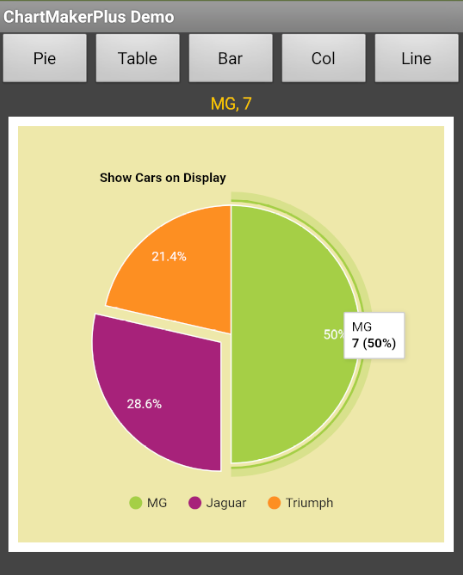
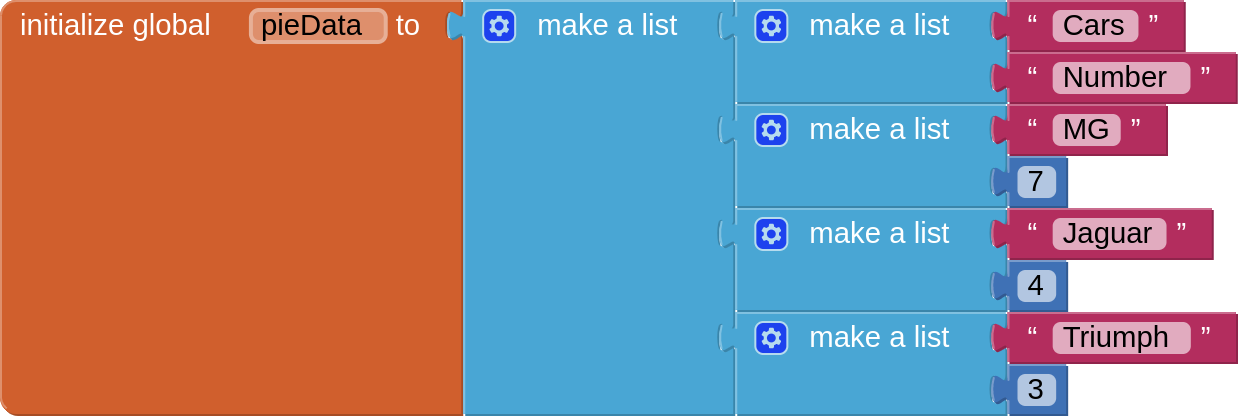
- Pie Chart
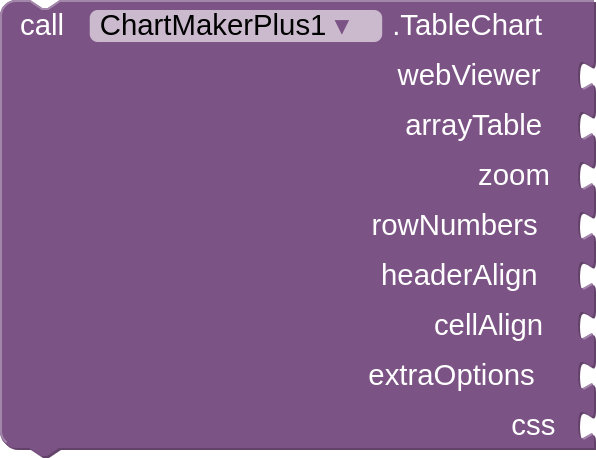
- Table Chart
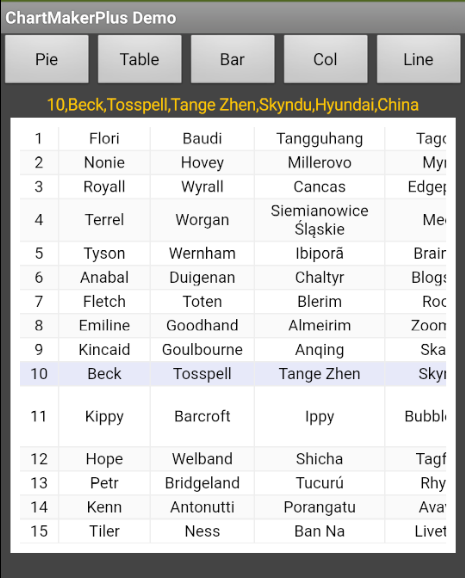
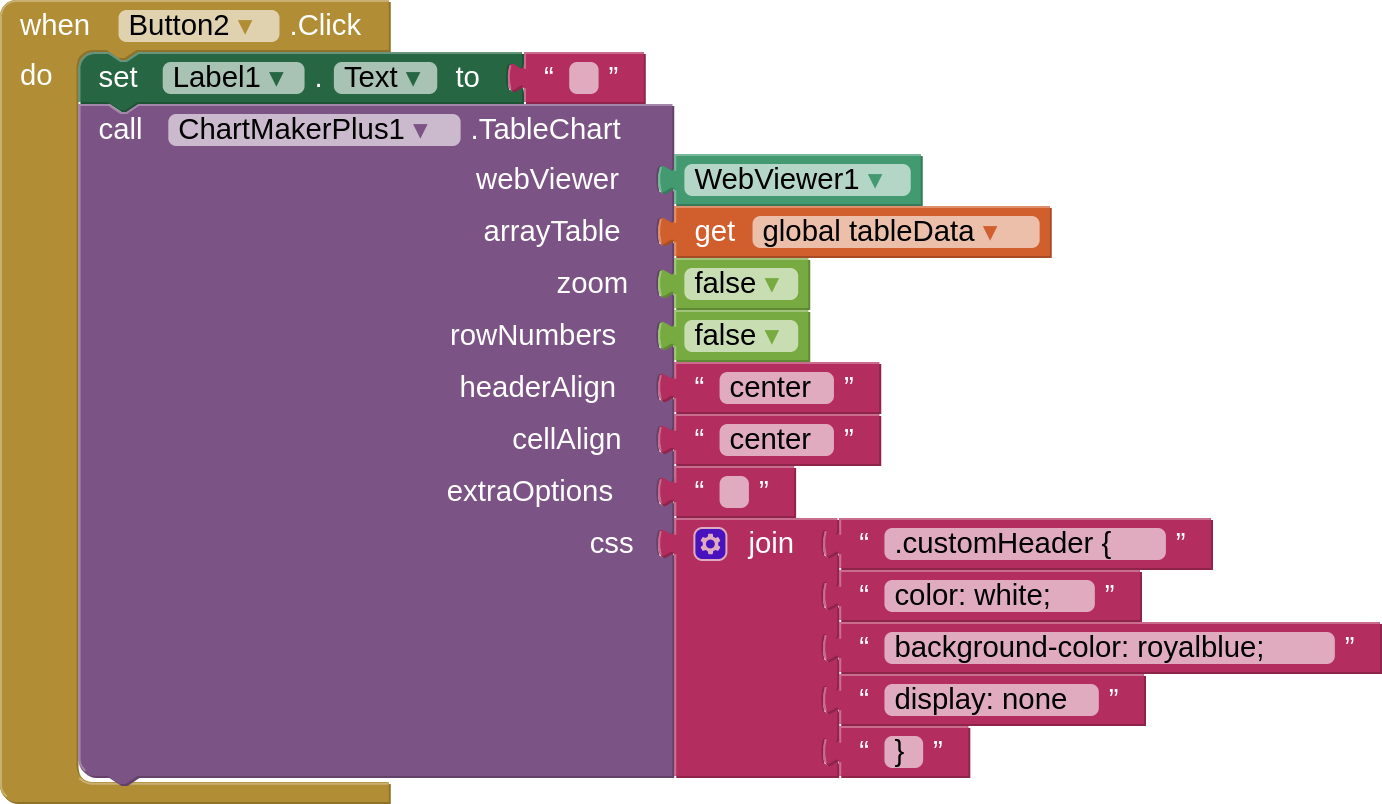
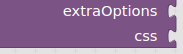
For adding css to the table, each of the cssClassNames, as shown in the Configuration Options, can be used. and example of this is shown in the blocks image above. The css classes have the same name as the listed class names with a custom in front. For example: `tableCell > customTableCell
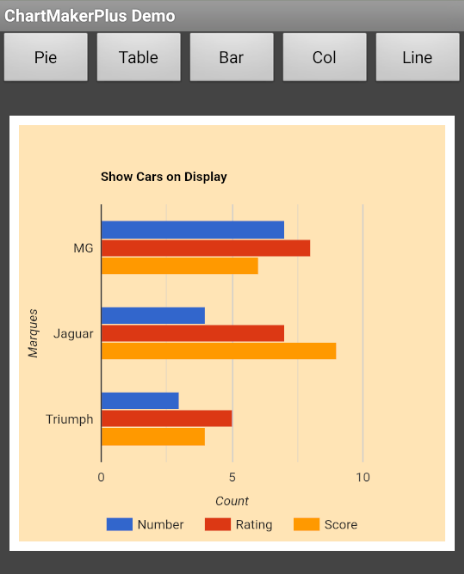
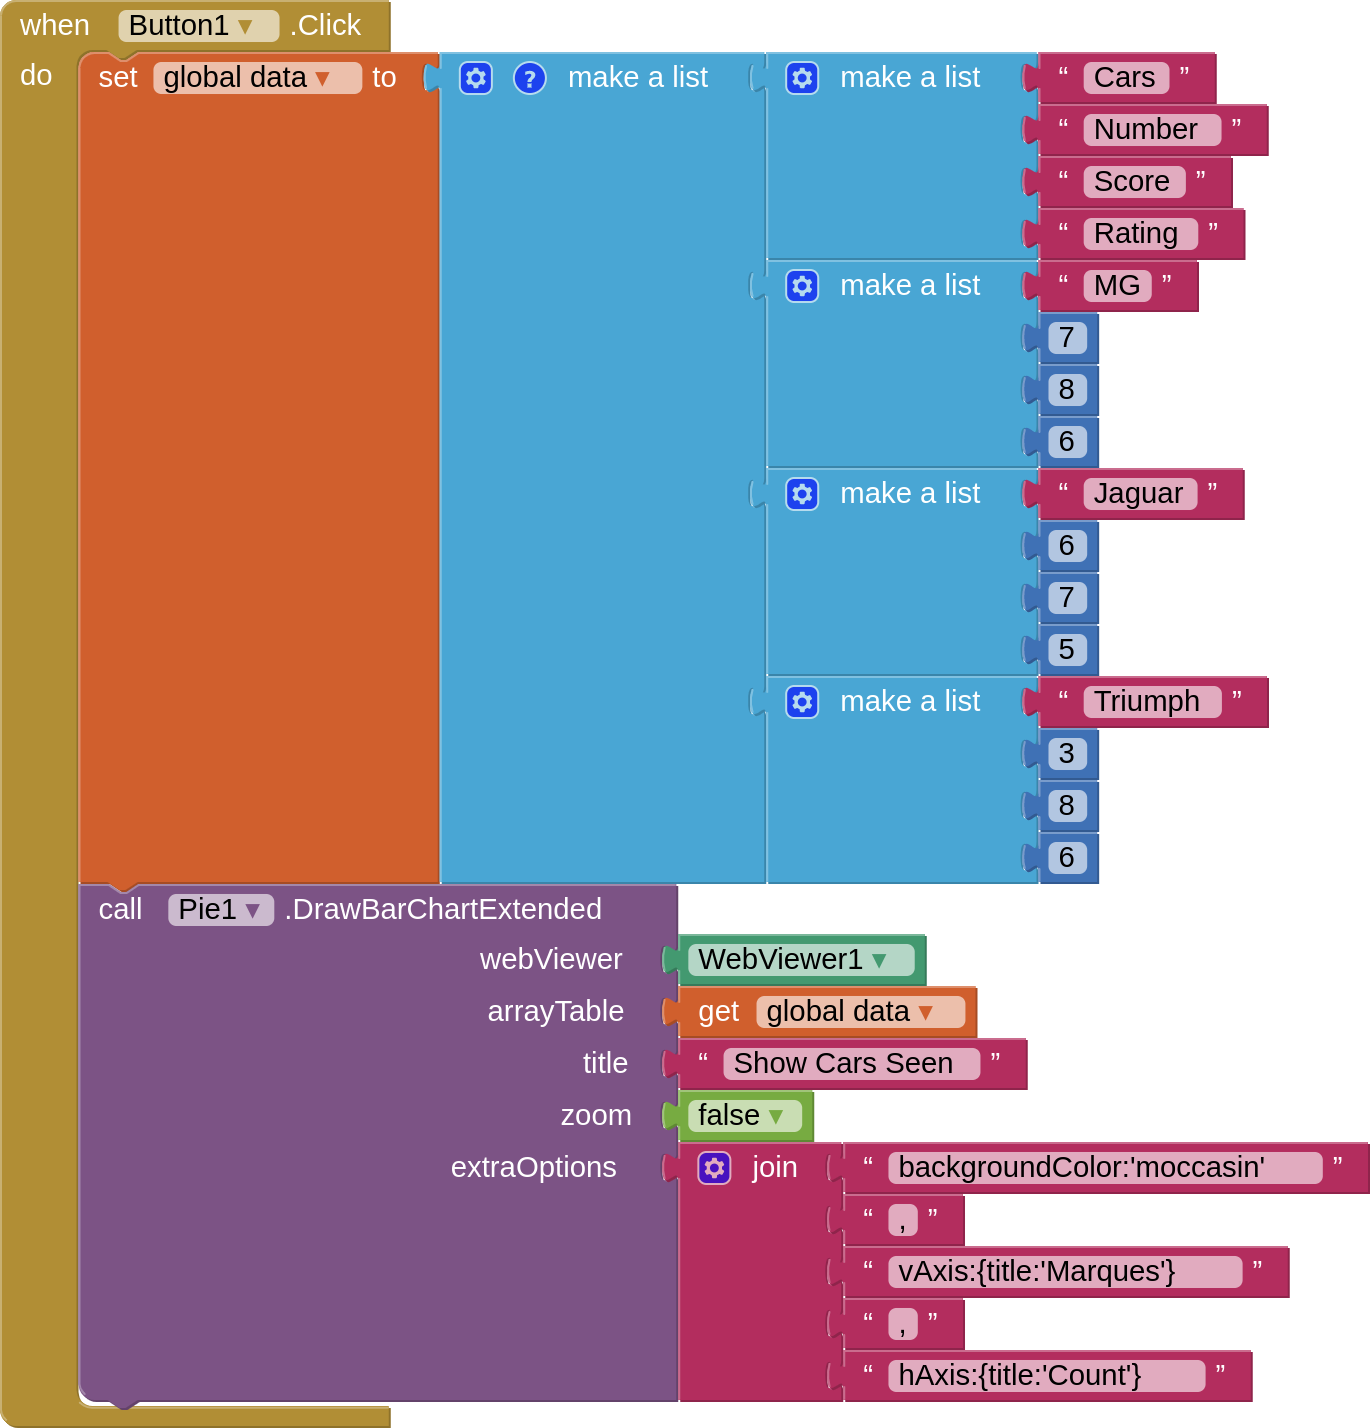
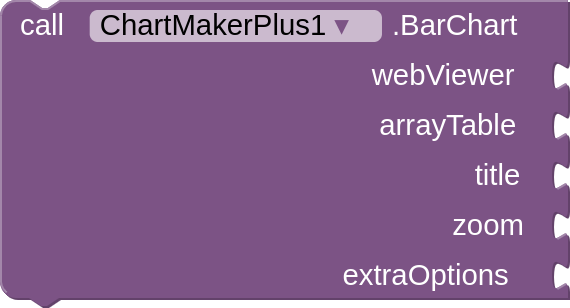
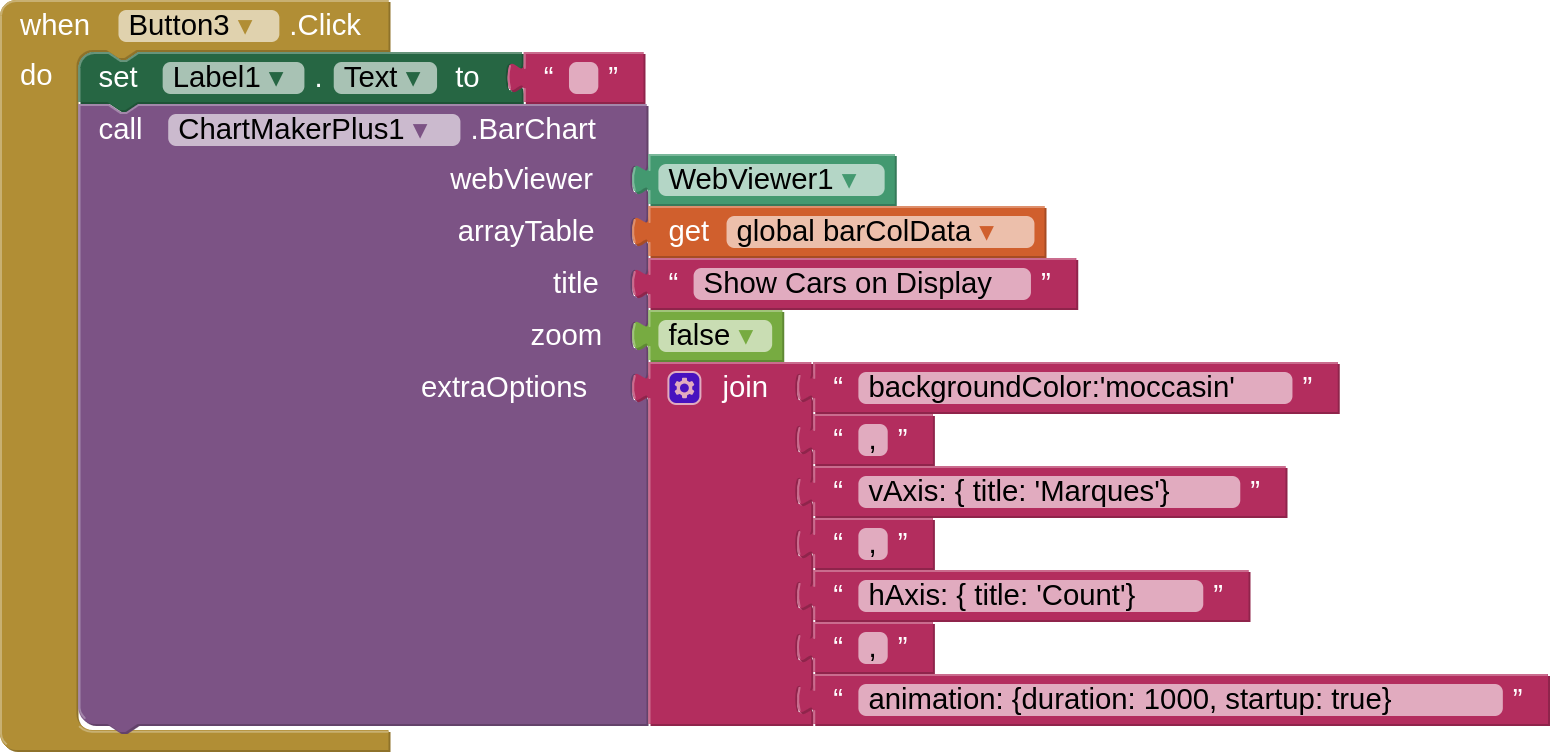
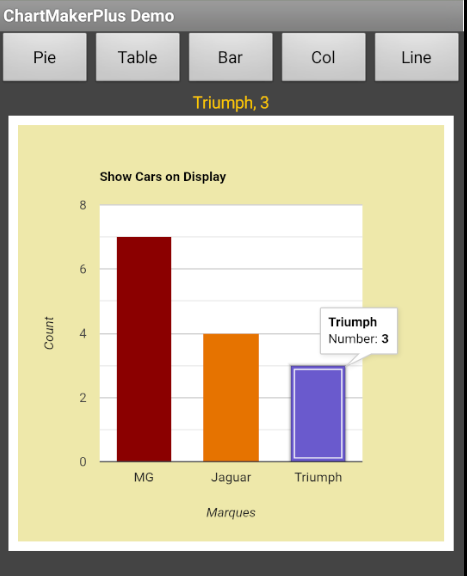
- Bar Chart

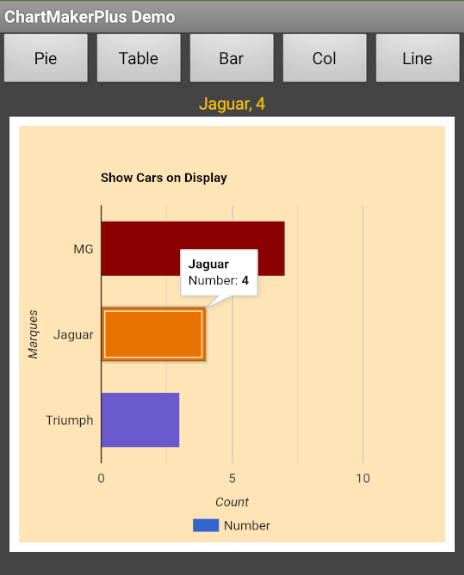
If you test the aia, you will see that this chart is also animated. The data blocks are for the second chart, and show how to set the colour of the bars for a single row of data.
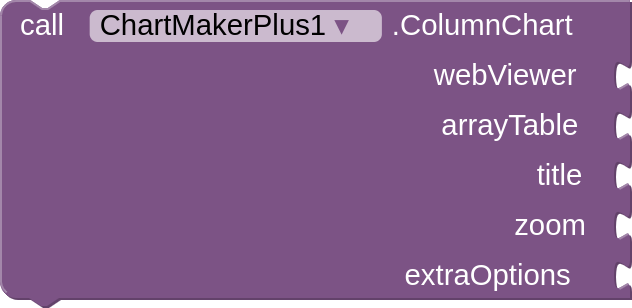
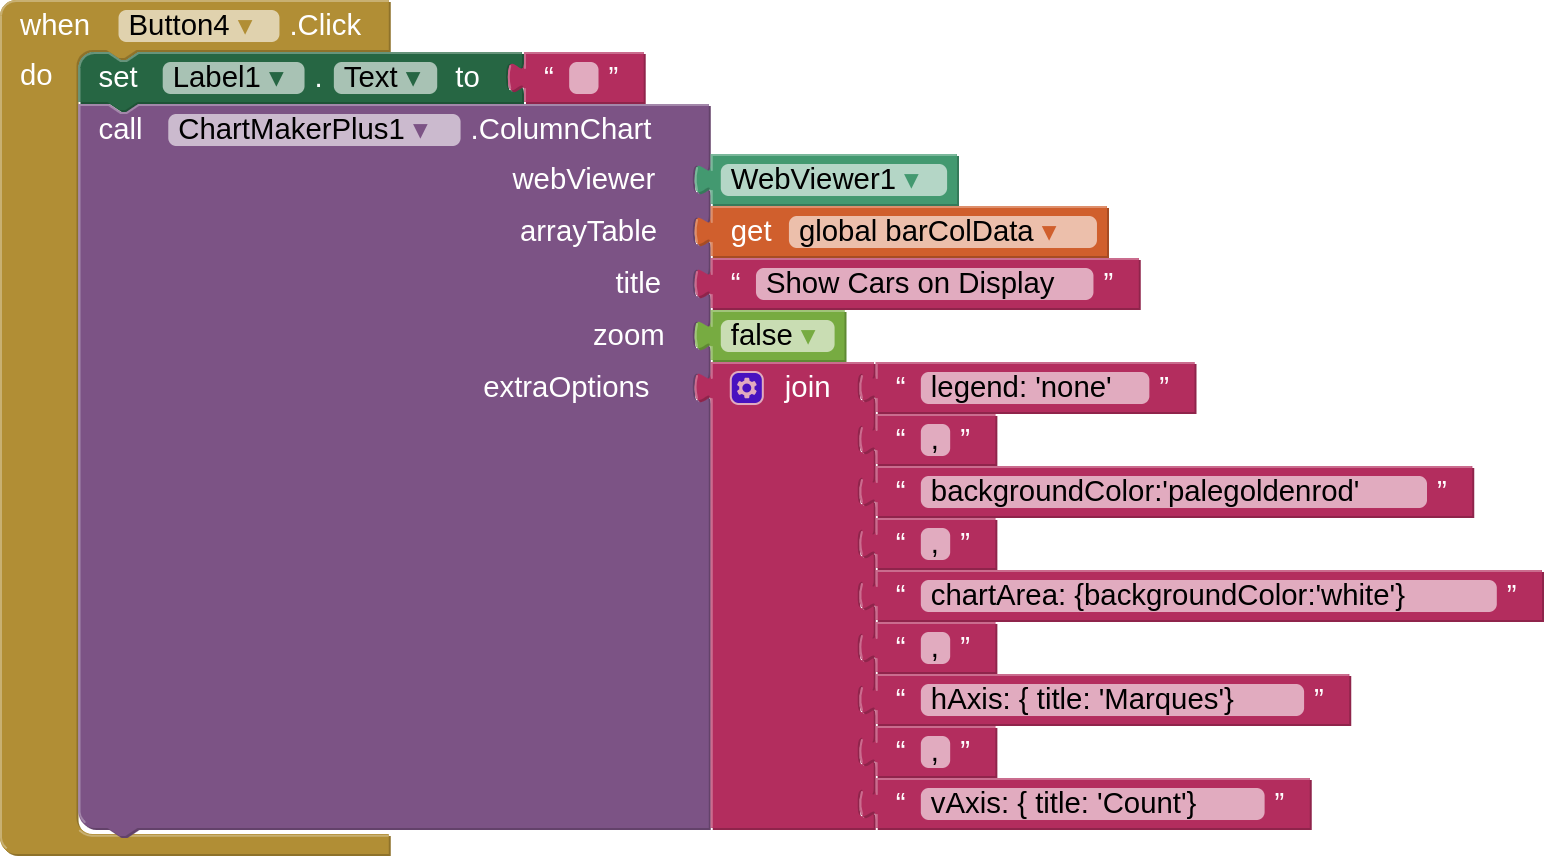
- Column Chart
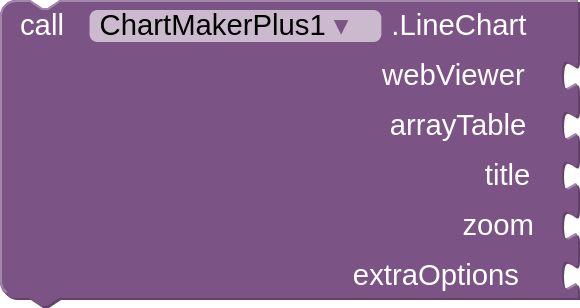
- Line Chart
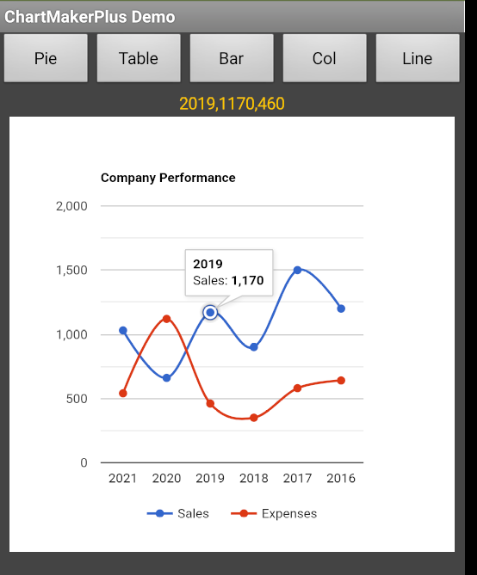

- Using Custom Webview
You will need to bring in the custom webview extension, Below are the blocks required to show a pie chart (you will also need the custom webview webviewstring change block to get data feedback):
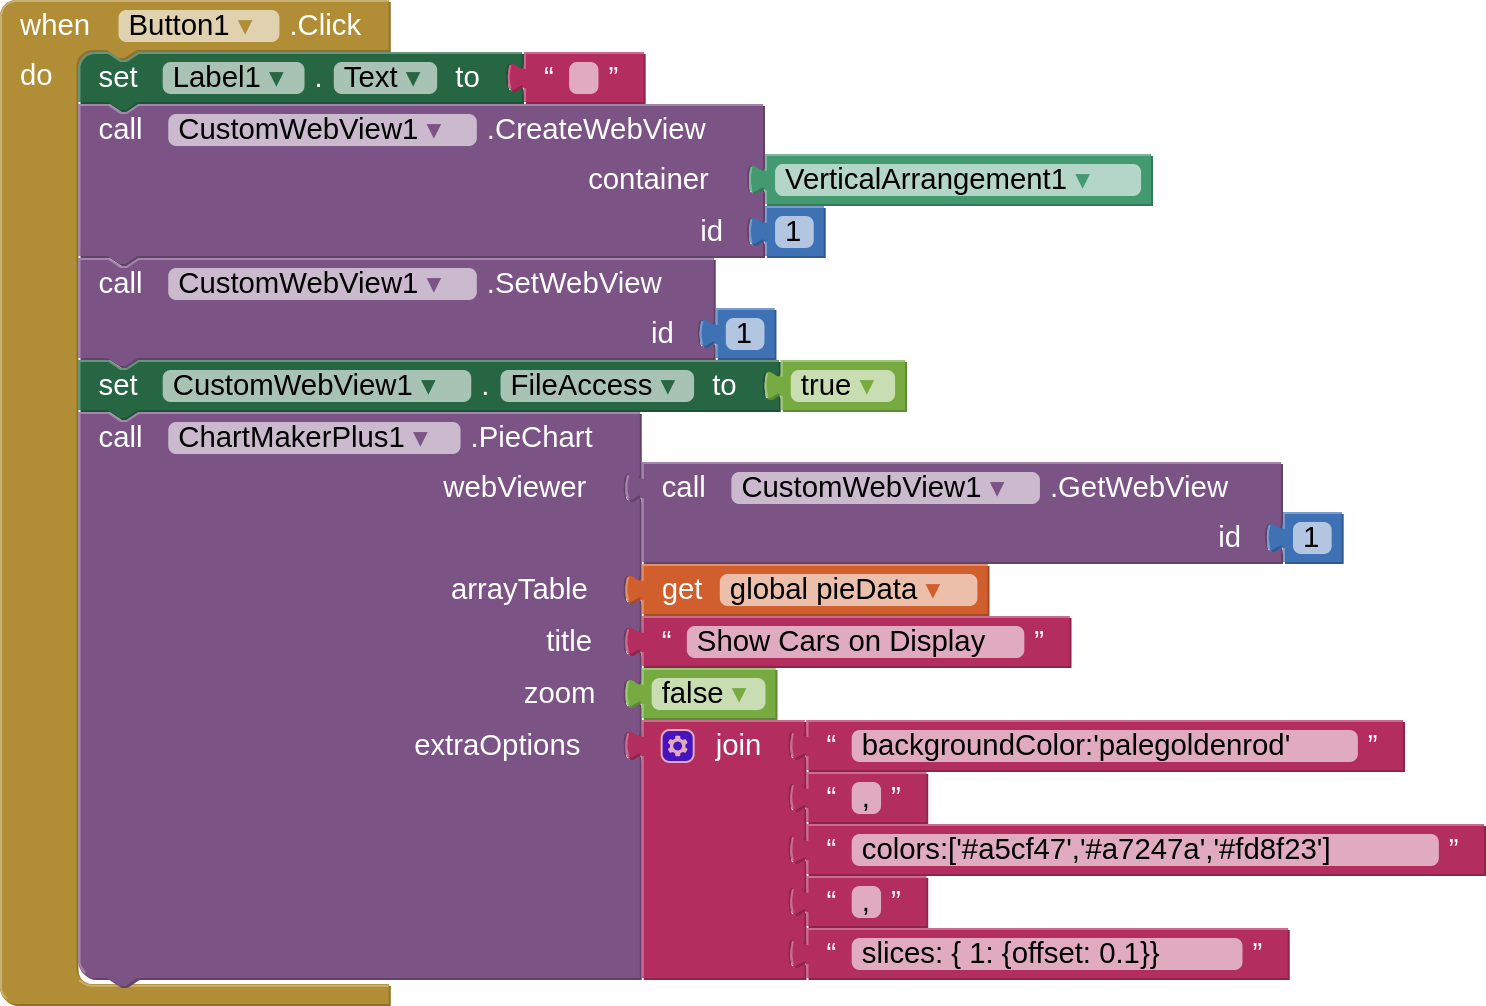
The order of the blocks is important...
4. Files
AIX: ChartMakerPlus v4
5. Changelog
- V1 - initial release
- V2k1 - updated to provide for file access in Kodular
- V3 - small update to add a css socket to all chart types. See here for usage
*V4 - small update, adding cssClassNames classes
6. Credits
My thanks to Mills College for the original extension, to @vknow360 for his help on getting the custom webview and file access to work, and to @shreyash for Rush
7. Bits and Bobs
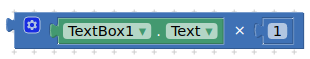
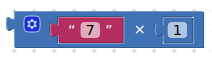
- Also see Strings and Numbers further down for information about handling numbers as strings in the
arrayTables. - ChartMakerPlus relies on json arrays (lists with square brackets) to send to Google Charts. Ensure that
ShowListsAsJsonis ticked in Screen1 properties in the designer (or convert your round bracket lists to square bracket lists)
Enjoy :D, and all feedback and comments welcome.
Available for use in any MIT AppInventor projects or competitions
#####################################################################
This work by TIMAI2 is licensed under an
MIT Licence.
#####################################################################


 /
/