ChartData2D PointStyle

Hello,

I want to change the Point style. I read the chart title but I didn't understand it. Can you help me with an example? Thanks.

image

Hello,

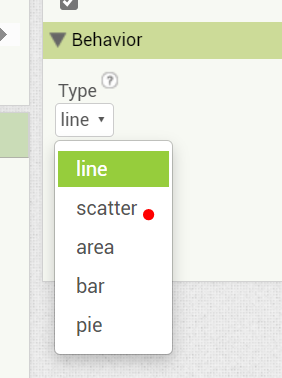
Triangle is only for Scatter charts...and can be set only in Designer:
image

You can also use an extension:

Thanks, I understand now. Actually, my goal was to make the Points invisible. I just wanted a chart with lines.

I want to draw a simple current and voltage graph with the data I receive from an electronic device. I could not draw a graph in chartmakerplus, but I drew it in chartmaker. Since it was a graph that was constantly expanding in the time domain, the graph was constantly deleted and reloaded.

I figured it out with the current chart, but the dots are annoying.

Thank you.

which problem do you have?

Take a look to this examples. First one, triangle points:

Without points:

with only this extraOption:
image

Yes I tried many things but no graphics, blank screen.

image

Are you online, on your device ?

Connected via usb with aiStarter.

Yes, but is your device online? Can you access the internet/view a web page with your app ? Google Charts requires a network connection.

yes connected, always.