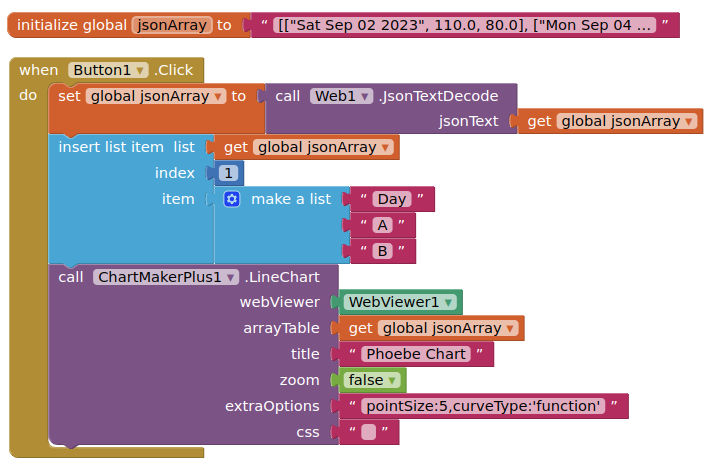
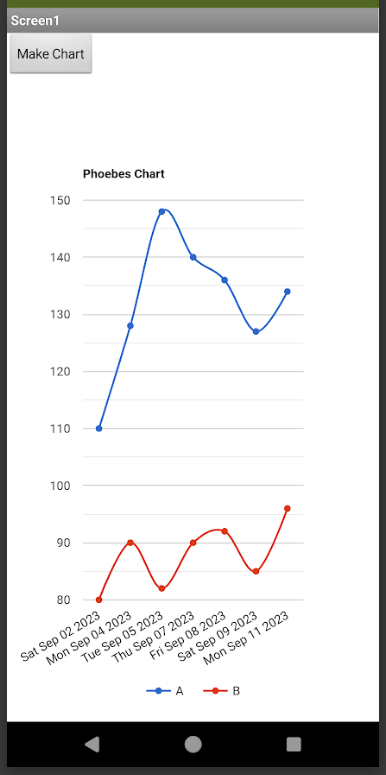
What type of chart (line/bar...) ?
There is an issue with your stringified json array. The data export from google sheets is exporting the date as a number, not a string (no double quotes around it)
This: [[Sat Sep 02 2023,110.0,80.0], ...],
needs to become this [["Sat Sep 02 2023",110.0,80.0], ...]
(it is not easy to convert this in AI2)
If you fix this (by converting the date number to a string, or exporting displayValues), then you can use the ChartMakerPlus extension to display your data. You will need to also add a header row.