Good to here you got it working 
1 Like
Thanks for helping me get this working, I looked in the documentation and did not see the JSON check box mentioned perhaps that should be updated as I spent hours thinking I was an idot
1 Like
As previously mentioned, I have now updated the documentation in the first post to cover the use of ShowListsAsJson
3 Likes
How change border color from white to custom color?
2 Likes
You can add a border to the chart with a custom colour in the extraOptions:
backgroundColor: {
    fill:'moccasin',
    stroke: 'black',
    strokeWidth:20
    }
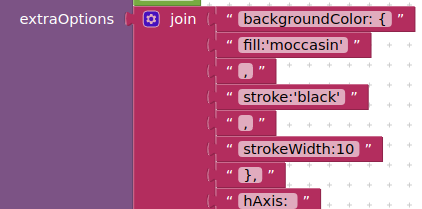
but this still leaves white border which is the html background.
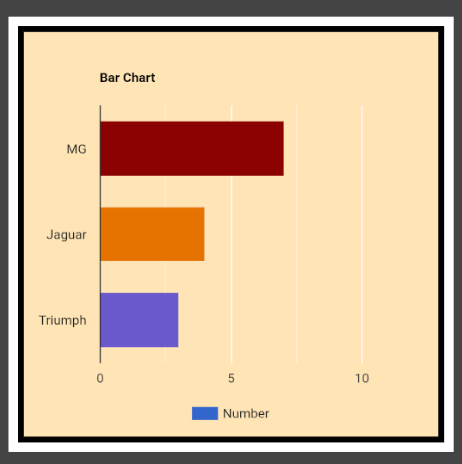
I would need to add another parameter to the chartmaker to allow the setting of the html/body background colour.
3 Likes
OK, that has worked up:

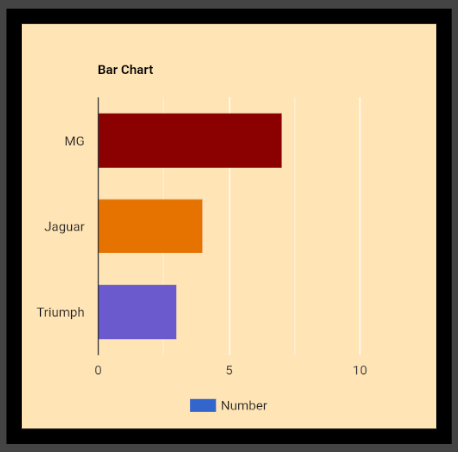
Here is the extension:
uk.co.metricrat.chartmakerplusv3k1.aix (10.0 KB)
Will just need to update the extension documentation in the first post for everyone else
3 Likes
Thanks for update. ![]()
![]()
Why chart is not shown and webviewer remains blank when haven't net and offline mode? ![]()
1 Like
See
2 Likes
[quote="[Free] ChartMakerPlus - an extension to make google charts Extensions, post:81, topic:36473"]
Try other chart methods for offline
[/quote]
which one?
1 Like
1 Like
You will need to look into the documentation for highCharts to find out.
Sorry, I thought you had moved on to HighCharts 
The google chart is placed inside a div in the body of the html page. By default the body has a default margin of @ 10px on an html page. You need to remove this, setting the margins to 0, in the css.
body { margin:0 !important;}
(if enabled, ensure you have the background-color strokeWidth set to 0 as well)
For the chart you can set the size of the chart in the javascript, to the window of the webpage using the width: window.innerWidth and height: window.innerHeight settings - in extraOptions (you may need to adjust these ,e.g. minus 1 or 2 in order to remove the scrollbars if they appear). This second part may not work/be necessaary, because the containing div has styles of 100% for width and height hard coded, outside of the javascript.
2 Likes
Hi, I'm trying to use this extension, and everything seems to be alright, but it doesn't show anything when I click the button, what could be a problem? Thank you
1 Like
It works, thank you
1 Like
@TIMAI2 Is there a way to detect when the chart has been received from Google (presents on screen)?
Thank You
1 Like
As suggested in your help topic, and here on post #70
2 Likes
Thanks .. I knew it had to be something I was overlooking 
1 Like
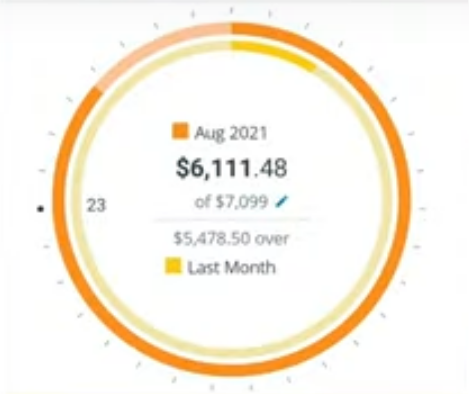
Hello, How can i put some values in the center of pie chart if pie chart have piehole.
1 Like