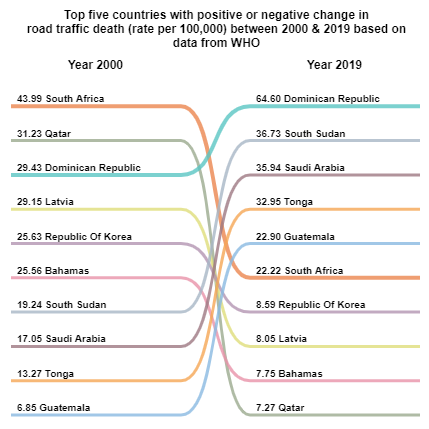
Hi, I built a visualization about "Top 5 countries with positive and negative change in road traffic death (rate per 100,000) between 2000 & 2019 based on data from WHO.
I am polishing my skills by creating simple and advance visualizations like this one in short time and without any programming skill.
What are possible visualizations available to depict data insights in MIT App Inventor? Thanks

You could use a chart component.
I have not seen your sample for AI2 yet.
If you want that specific chart type, I would try this for a Canvas-based solution:
- Match up your list of countries and their old/new ranks against a list of colors
- Derive the y coordinates of the various colored lines based on Canvas1.Height and your list lengths
- Draw the texts for your countries and their old and new values above the colored lines
- Draw the colored lines on the left and right
- Plot sections of sine curves to bridge the colored lines across the gaps. Sine curves have flat sections at +/- 90 degrees that could be used to link up to the left and right colored line segments, given a proper displacement and multiplier factor.
Thank you for your response.
Thank you I will definitely try these.
This topic was automatically closed 7 days after the last reply. New replies are no longer allowed.