What method will you be using to generate your chart for AppInventor ?
Use month number for the x value, and mention the year elsewhere.
Use month number for the x value, and mention the year elsewhere.
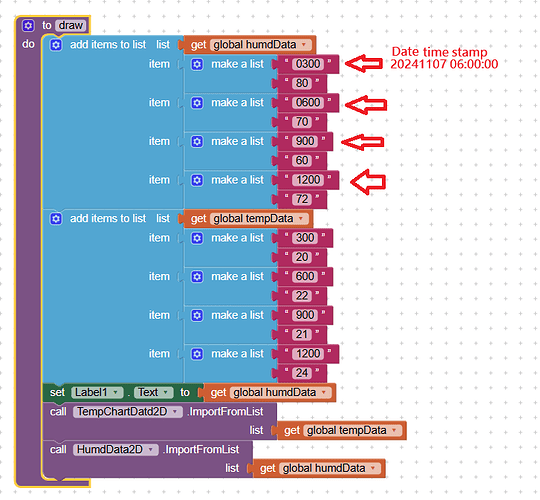
For now, this is probably the only way to do it. However, My API data is from OpenWeatherAPI and the date provided is a text like "20241107 11:00:00".
API data retrieved is in 3 hours interval and for 4 days. So I need to place date on the X-axis, like "1107 12:00", "1107 15:00"....."1110 09:00".
Just wondering why the X-axis must be numbers and can not be text? What's the limitation? Since ChartData2D data are stored in lists, can't they be text type?
Thank you,
Stonez56
I would look into this further tomorrow, researching what determines the order left to right of the data points on an AI2 plot.
Is it sorted by x, or is it in index order?
Openweather API return data in JSON format. So, users can manipulate to whatever format they need. In this case, I wish the X-Axis to be date/time(text).
Thicker lines would also preferred. ![]()
Thank you for your further investigation!
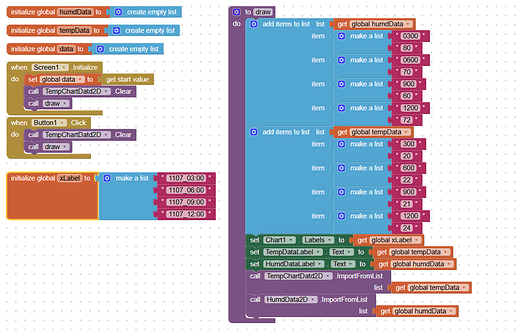
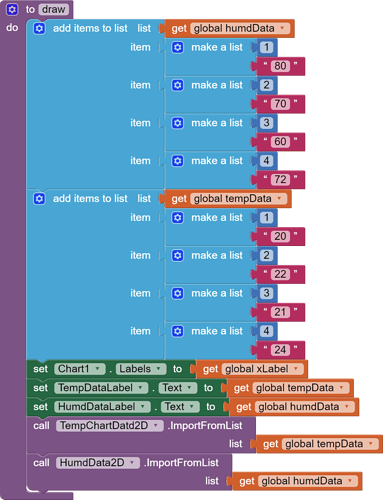
Here is a chart block I have:
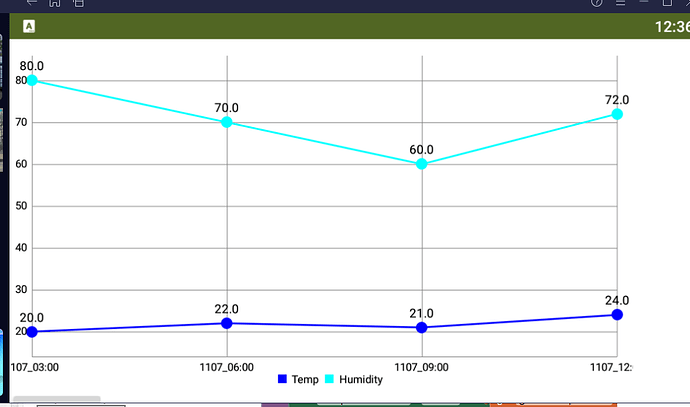
Here is the result:
The first few links might explain it.
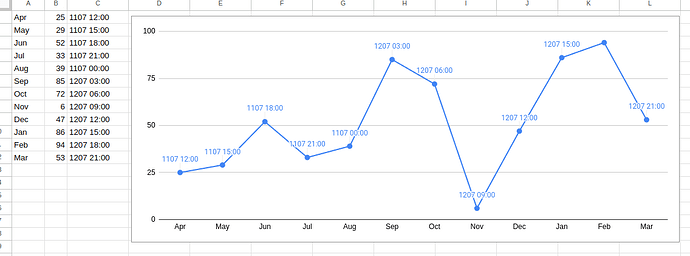
Thanks, but I would like to this type of chart display on the App Inventor App, not Google Sheet.
LabelsFromString
Specifies the labels to set to the Chart’s X Axis, provided the current view is a Chart with an X Axis. The labels are specified as a single comma-separated values String (meaning each value is separated by a comma). See Labels for more details on how the Labels are applied to the Chart.
(From the AI2 Chart help page)
Hi ABG,
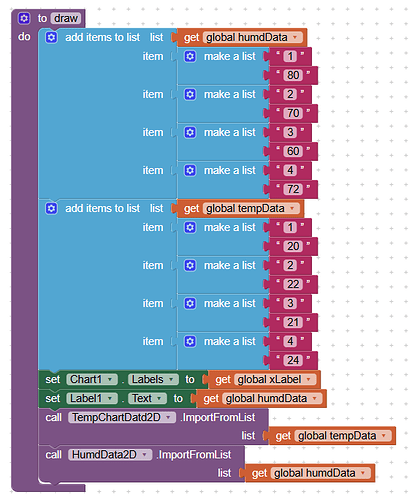
I made a quick test on LabelsFromString.aia
Testing results:
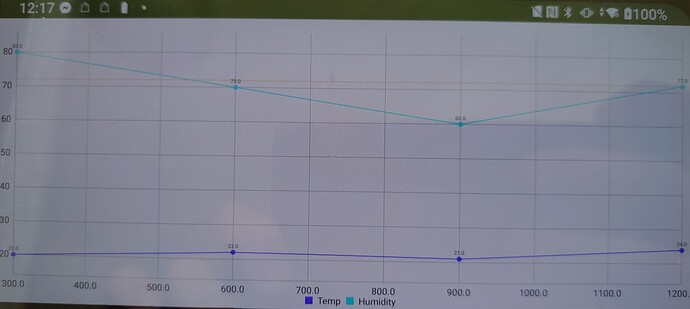
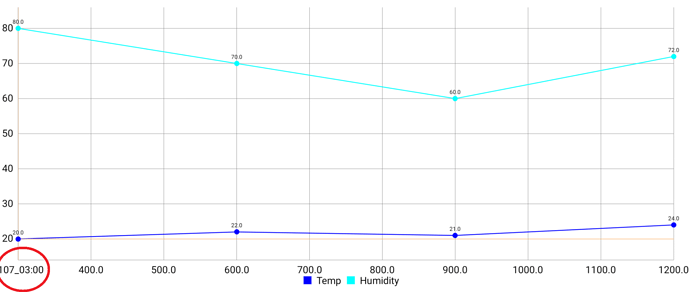
Only the first StringFromLabel was showing on the chart(see red circle below). Very weird. Also, I only have 4 data point, but X-axis still auto-generated numbers to fill in the gaps between my original data.
Here is .aia file
Chart_label_from_String.aia (3.4 KB)
Stonez56
I saw ChartMakerPlus, but extensions do not work with iOS...too bad.
In which case just build an html file for a line chart, and include the options to add labels to the series.
From a closer reading of the Labels attribute docs:
(Some clipping at the edges, sorry)
The new loader procedure with x = 1,2,3,4
(draggable)
Chart_label_from_String (1).aia (3.6 KB)
Thank you for the solution!
I intended to make the index from Numbers into Strings and it still work.
Looks like the String will be convert to numeric during the charting process.
[Suggestion for AI2] Instead of using the extra StringFromLabel, would it be better for AI2 not converting the String back to Numbers. So, all the data needed to chart are in the list(using datetime stamp to replace 1, 2, 3, 4...here)?
I have another question regarding Chart when using "Chart1.EntryClick". If it is not good to continue the discussion here, I will create another thread, thanks!
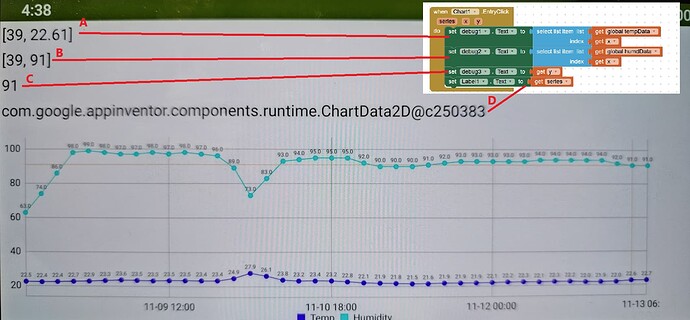
When Chart1.EntryClick:
A is result from x (index of that list) this is OK
B is result from x (index of that list) this is OK
C is showing where you touched at; temperature or humidity. this is OK
D Not sure why the Series is showing the Android component name? (Why?)
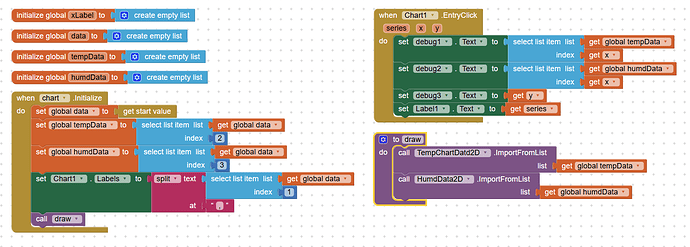
The codes:
Thank you!
Stonez56
A better name for that value would have been seriesComponent, to denote its type.
Having the component of the series gives you access to all the blocks of the data series component and the data loaded into it.
You would use generic (Any) blocks with the series component.
After I completed the code for Android, I found out that ...Chart is not yet support on iOS!! In the end, I will need to go through the Javascript route.
Thanks for everyone's help!
Stonez56
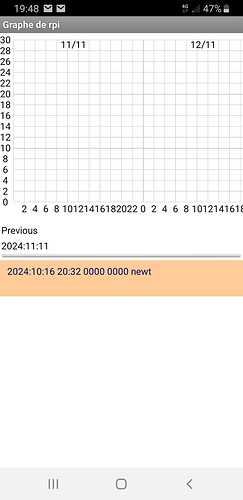
I remember makig a graph with axes ; I draw hours along horizontal axis using canvas.DrawText but I could write any text if I wanted to.
I calculated myself x, y coords to place that text
