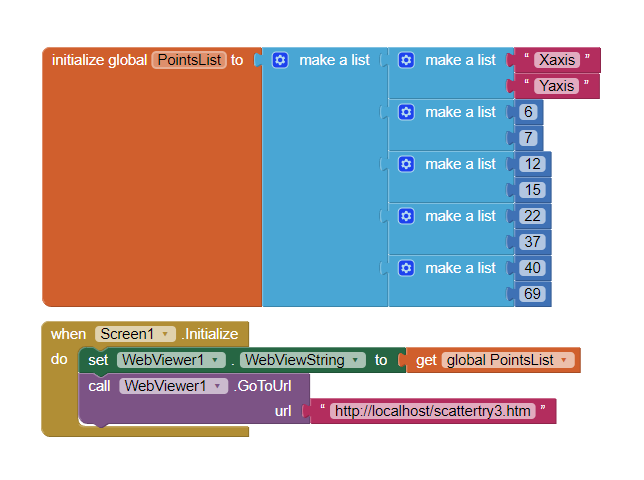
I try to use google charts with the webviewer. There is no problem rendering the chart when the data is in the script but when i try to pass my data it cant render. Can anyone find the problem here?
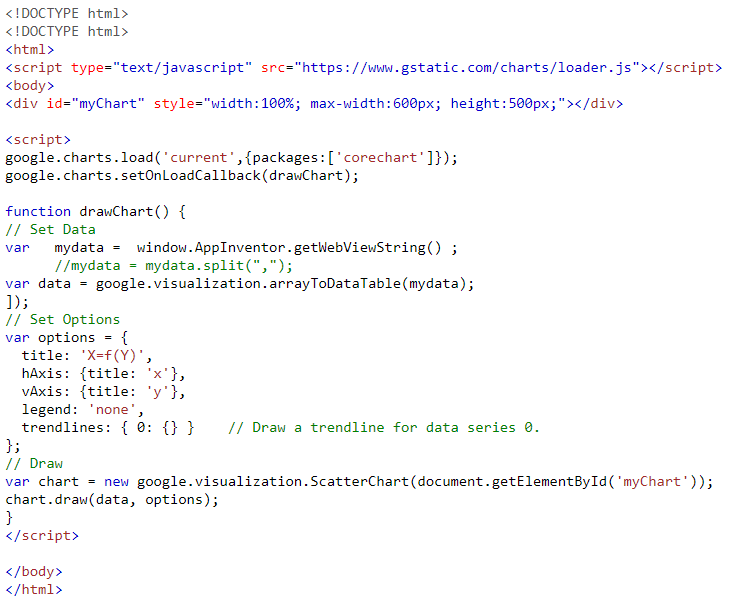
and here is the html.
I also tried the ...mydata.split(",").. but didnt work so I have it in comment
Your issue is that the webviewstring can only handle, erm, strings.
You are setting the webviewstring with a list (an object). You can decode the list by setting it to a label, but then you have a stringified json. You will need to convert this to a json array once it arrives in the google chart script.
You could of course always try:
which handles most of this for you ![]()
Thank you very much for your immediate answer. ChartMakerPlus is a fine extension but I need a scatter chart and it cant be done with it.
In my opinion what I will do is, i will store data in Google sheets and create a chart in Google sheets itself and Use the Chart URL in web viewer, which will be dynamic and the Chart gets updated automatically every 5 minutes
I am pretty certain that a chart created in Google Sheets does not have a url, you have to take an image of the chart using Google Slides.
You can of course use the data from google sheets to generate a gviz google chart
If you are still struggling, share your aia project or example with data, and I will put something together for you.
I try to make an app for the school science lab. The user, inserts the measurements and he/she will see the scatter plot and the regression line. There is no problem with the rest of the code except for the part of transferring the data of the table to the javascript, so I will send you just that part.
Thanks in advance.
testchart.aia (3.4 KB)The html file
Sorry for the delay, real world things to attend to.
The webviewstring is converting the list to a string automatically, however we need to convert what was a list into a JSON array for the chart to work. We do this with JSON.parse.
Try this:
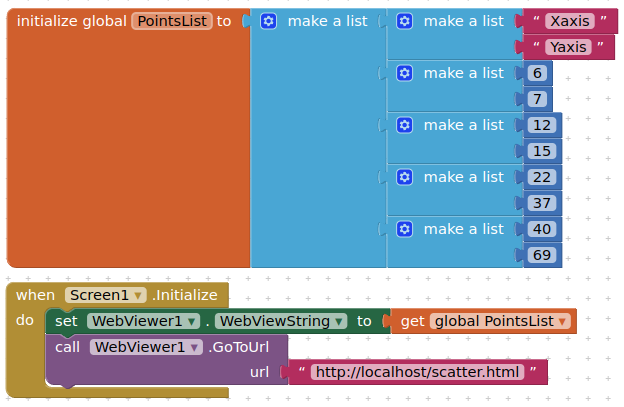
scatter.html
<!DOCTYPE html>
<html>
<script type="text/javascript" src="https://www.gstatic.com/charts/loader.js"></script>
<body>
<div id="myChart" style="width:100%; max-width:600px; height:500px;"></div>

<script>
google.charts.load('current',{packages:['corechart']});
google.charts.setOnLoadCallback(drawChart);

function drawChart() {

var mydata = window.AppInventor.getWebViewString();

var data = google.visualization.arrayToDataTable(JSON.parse(mydata));


var options = {
  title: 'X=f(Y)',
  hAxis: {title: 'x'},
  vAxis: {title: 'y'},
  legend: 'none',
  trendlines: { 0: {} }
};

var chart = new google.visualization.ScatterChart(document.getElementById('myChart'));
chart.draw(data, options);
}
</script>

</body>
</html>
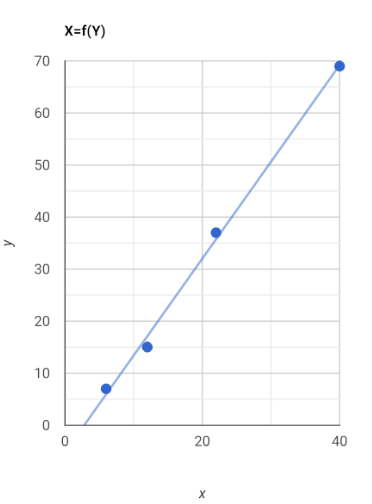
Chart
No, you can click the three dot in Google Sheets Chart and copy the link of the Chart and embed on site or visit the URL and you get the Chart image
You are correct, I confused this with getting an image of the chart. However, the direct approach, using gviz and html is more suitable in an app.
1 Like
but that method doesn't need html knowledge ![]()
Just to round this off, another method you can use is setting a data uri for the html in text blocks and using the list directly. You must ensure that you do not have ANY html or javascript comments in your html content.
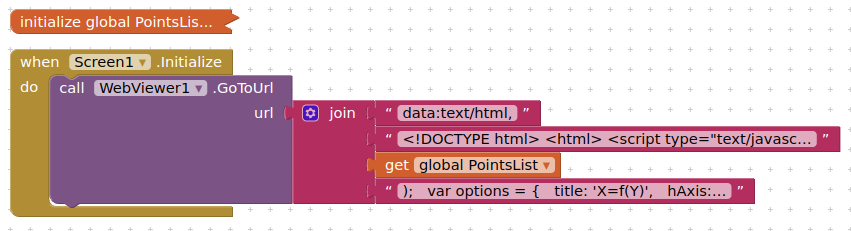
The two parts of the html:
<!DOCTYPE html>
<html>
<script type="text/javascript" src="https://www.gstatic.com/charts/loader.js"></script>
<body>
<div id="myChart" style="width:100%; max-width:600px; height:500px;"></div>
<script>
google.charts.load('current',{packages:['corechart']});
google.charts.setOnLoadCallback(drawChart);
function drawChart() {
var data = google.visualization.arrayToDataTable(
insert the list of values here
);
var options = {
  title: 'X=f(Y)',
  hAxis: {title: 'x'},
  vAxis: {title: 'y'},
  legend: 'none',
  trendlines: { 0: {} }
};
var chart = new google.visualization.ScatterChart(document.getElementById('myChart'));
chart.draw(data, options);
}
</script>
</body>
</html>
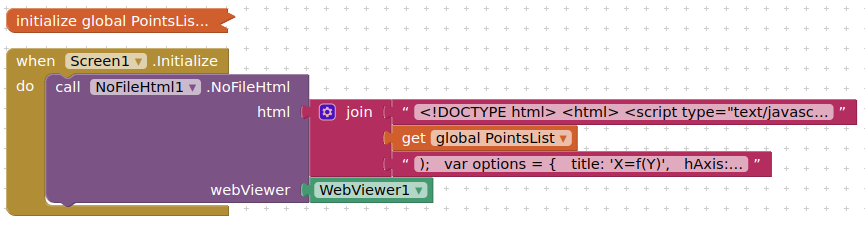
You could also use my NoFileHTML extension to do a similar thing (this too will not allow comments in the html content)
2 Likes
So you just have to split the html file (string) where you want to pass the values of your variables . And this time you dont have to use the JSON.parse method. Very nice !
1 Like
Also means that while developing you can just edit the html while in companion mode, no need to keep uploading a revised html file.
2 Likes
If you want a blocks-only approach and don't mind beta-testing, see the last entry at
1 Like
This topic was automatically closed 7 days after the last reply. New replies are no longer allowed.