MIT App Inventor Community
How do you use the chart2D plugin to create a chart with time as the horizontal axis
MIT App Inventor Help
charts
Kevinkun
July 6, 2023, 10:37am
3
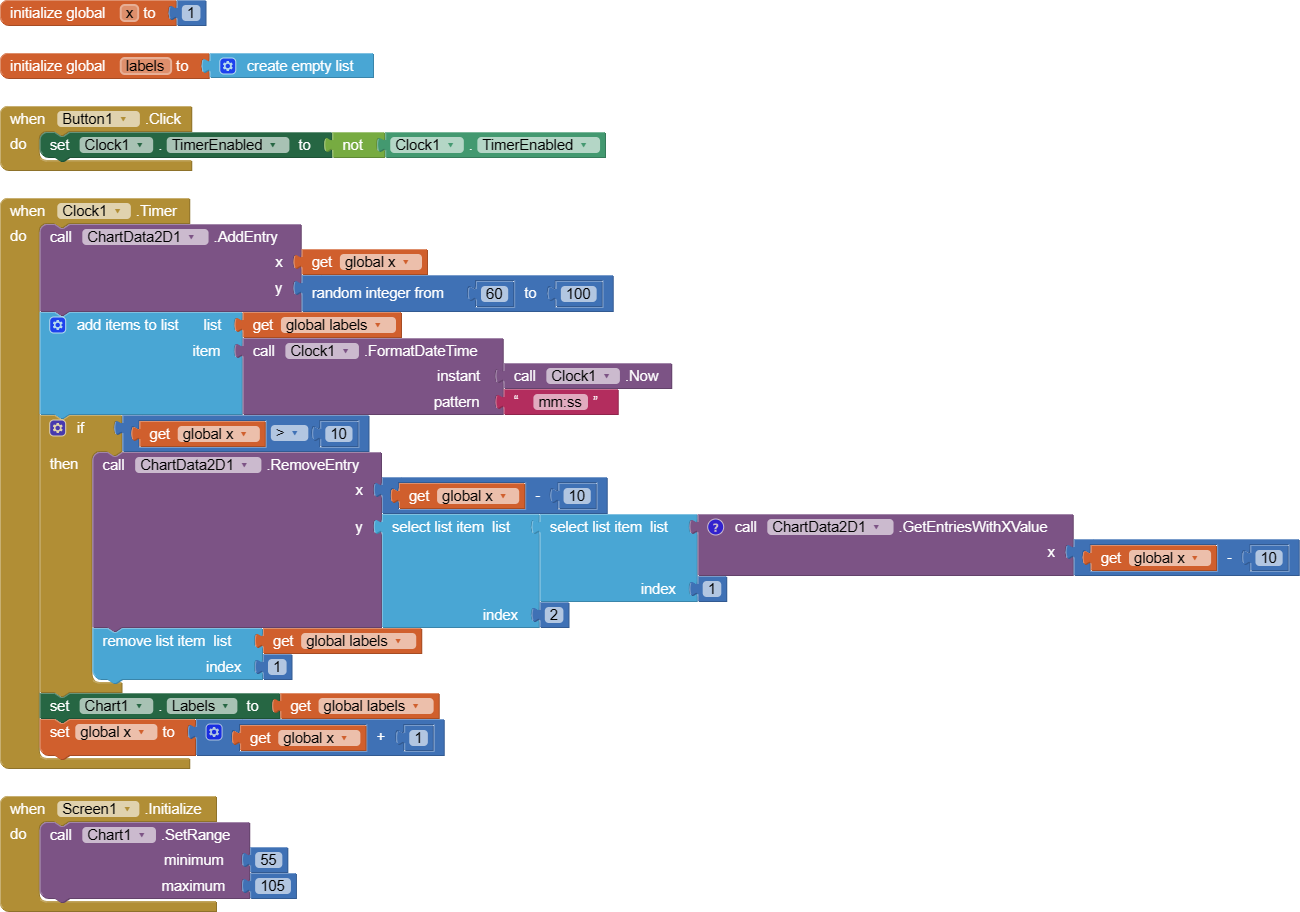
realtime_chart.aia
(3.0 KB)
here is an example.
It will update every 1 second.
blocks (17)
1300×912 65.5 KB
5 Likes
How to real time update the chart2D?
:bar_chart: [Free] ChartMakerPlus - an extension to make google charts
FAQ Section: Charts and Graphs
Line Chart with time on x axis
Regarding receiving epoch value
Graph line changes from curve to straight line over time, even when data stays the same
show post in topic