How do you use a Wheatstone Bridge to calculate Resistance using Bluetooth?

Thanks for your reply, This is my project, and also please let me know how i can connect to Arduino code.
Belal2025.aia (1.9 MB)

My app will be for gas sensing that can take the data from the ESP32 as voltage and convert it to resistance using a Wheatstone bridge. After that, convert the resistance to a sensor response using R/Rbaseline. What I also have to set is the response and recovery time in the app to calculate the R baseline and R for gas; then it can convert the detected sensor response to ppm using the calibration screen from the slope itself. Also, I need to make three layers for alarming green, yellow, and red by something like a gauge shown on the screen and also send an alarm to the user.

Looking at your TinyDB usage, I see you made 19 TinyDB instances, all on NameSpace TinyDB1.

For every tag you used, you added a new TinyDB.

Since the tags are unique, there's no point to that. They could live together in TinyDB1 or a dictionary stored in TinyDB under a timestamp tag, since you mention using a time series.

This Bluetooth code is wrong.

vout will always be set to FALSE, the result of comparing a list to a blank text.

image

Post your Arduino code here, so we might compare data types across platforms.

image

How can three different variables be assigned from the same start value?

Don't use start value.

Access data through TinyDB1 tags, like 'Slope', 'R4', 'Rb'.

Since you are using the BlueTooth Client, and have not yet shown your sketch that sends the data, I will assume your sketch sends them using print and println(), separated by commas, in a set message format.

Here is standard Bluetooth code for receiving and posting such messages.

BlueTooth_delimiter_sample.aia(3.4 KB) global message

Be sure to use println() at the end of each message to send from the sending device, to signal end of message.

Only use print() in the middle of a message.

Be sure not to println() in the middle of a message, or you will break it into two short messages and mess up the item count after you split the message in AI2.

Do not rely on timing for this, which is unreliable.

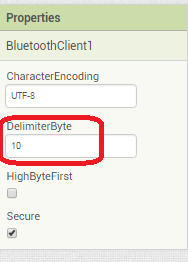
In the AI2 Designer, set the Delimiter attribute of the BlueTooth Client component to 10 to recognize the End of Line character.
BlueToothClient1_Properties
Also, return data is not immediately available after sending a request,
you have to start a Clock Timer repeating and watch for its arrival in the Clock Timer event. The repeat rate of the Clock Timer should be faster than the transmission rate in the sending device, to not flood the AI2 buffers.

In your Clock Timer, you should check

  Is the BlueTooth Client still Connected?
  Is Bytes Available > 0?
     IF Bytes Available > 0 THEN
       set message var  to BT.ReceiveText(-1) 

This takes advantage of a special case in the ReceiveText block:

ReceiveText(numberOfBytes)
Receive text from the connected Bluetooth device. If numberOfBytes is less than 0, read until a delimiter byte value is received.

If you are sending multiple data values per message separated by | or comma, have your message split into a local or global variable for inspection before trying to select list items from it. Test if (length of list(split list result) >= expected list length) before doing any select list item operations, to avoid taking a long walk on a short pier. This bulletproofing is necessary in case your sending device sneaks in some commentary messages with the data values.

Some people send temperature and humidity in separate messages with distinctive prefixes like "t:" (for temperature) and "h:" (for humidity).
(That's YAML format.)

The AI2 Charts component can recognize these and graph them. See Bluetooth Client Polling Rate - #12 by ABG

To receive YAML format messages, test if the incoming message contains ':' . If true, split it at ':' into a list variable, and find the prefix in item 1 and the value in item 2.

In Screen2, what is this for?

image

I cannot proceed further on this until I see the Arduino code that sends the data over BlueTooth.

Belalv2.aia (1.9 MB)
Thanks for your reply.
Please check, as I did a lot of modifications in the project. The app gives an error the ((Bad argument t + and rotate)).

#include "BluetoothSerial.h"
#include <Adafruit_ADS1X15.h>

#if !defined(CONFIG_BT_ENABLED) || !defined(CONFIG_BLUEDROID_ENABLED)
#error Bluetooth is not enabled! Please run `make menuconfig` to and enable it
#endif

BluetoothSerial SerialBT;
Adafruit_ADS1115 ads;  /* Use this for the 16-bit version */
//Adafruit_ADS1015 ads;     /* Use this for the 12-bit version */
  int16_t adc0, adc3;
int Value_CH1;
int Value_CH2;

float Voltage;
float Current;
float contres=8000; 
float contvoltage=3.3; 
float Unknown_Res;
String senddata="# ";

void setup() {
    pinMode(2, OUTPUT);
    Serial.begin(115200);
    SerialBT.begin("BELAL",true); // Bluetooth device name
    ads.begin();
}

void loop() {
   
  Value_CH1 =ads.readADC_SingleEnded(0);
  Value_CH2 =ads.readADC_SingleEnded(1);

  Current = Value_CH1*100/5334.8484848484848484848484848485;   
  //Serial.print("Current: ");
  //Serial.println(Current);

  Voltage=(Value_CH2-Value_CH1)/5334.8484848484848484848484848485;
  Unknown_Res= ((0.5+(Voltage/contvoltage))/(0.5-(Voltage/contvoltage)))*contres;
  Serial.println(Unknown_Res);
  //Serial.print("Voltage: ");
  //Serial.println(Voltage);

  //Serial.print("Resistance: ");
  //Serial.println((Voltage*1000000/Current));

  digitalWrite(2, HIGH);
  delay(500);
  digitalWrite(2, LOW);
  delay(500);
  if (SerialBT.connected(1000)) 
  {
    senddata=senddata +Value_CH1 +" ";
    senddata=senddata + Value_CH2+" ";
    //senddata="Hello";
    SerialBT.print(senddata);
    Serial.println(Unknown_Res);
    Serial.println(senddata);
    senddata="# ";
  }
}

The following will probably help making a gauge. You can color sectors of the gauge red, yellow. green using the html script modified.

image
Thanks, I did it, but something else remains, as the app is still giving errors
Please check my project
Also please I need to make a chart like this and controlling the scale of x and y by min and max
image

Also, I need to save the live data to an Excel sheet on my mobile and on Google Sheets. so how I can do


I got this error from screen 2

I isolated where you send to Bluetooth:
image

The SerialBT print lacks a \n end of line delimiter, so I expect trouble in the app.

Also, I see you are using blanks as delimiters, instead of the usual commas.

AI2 text blocks tend to eat blanks, so I expect trouble there too.

(I added ``` lines to highlight your code with indents.)

1 Like

image

AI2 blocks have tool tips, visible when you hover the cursor over them.

The Sprite Rotates attribute should be either true or false, never a number.

Maybe you wanted to change Sprite's Heading, converting ppm to degrees with a little math?

1 Like

image

Here, you are using global Recoverytime as a number (0) AND then as a logical true/false value?

How is that supposed to work?

Also, you are recovering Timercounter from TinyDB, with a default value of blank text?
By its name, I would expect a counter to be a number , one that would be able to participate in math operations. Blank is anathema to math blocks. They choke and issue error messages.
Use 0 for default TinyDB numerical return values, to avoid this.

1 Like

Actually, I need to control the baseline resistance and gas resistance at certain times by seconds to calculate the response time. Please see the provided image
image

If you plan on analyzing the variation of Rg over time, you need to accumulate a list of (Clock1.SystemTime, Rg) values.

I am unable to match your sketch variables Value_CH1 and Value_CH2 with any of your AI2 global variable names.

Is your sketch author on the same team as you?

1 Like

Actually this is not my graph but this is the same as I have for my work for resistance variation over time

Here is a sample graph over time:

You need to get your two incoming data values onto one message, ending in \n, to assure they stay in sync.

1 Like