MIT App Inventor Community
Connecting TinyDB to ChartData2D
General Discussion
charts
,
tinydb
ABG
May 15, 2024, 11:23pm
13
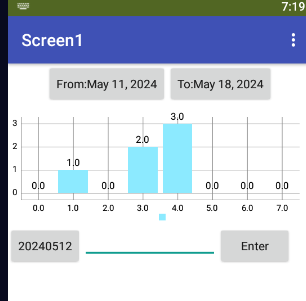
A sample bar graph by date:
bar_graph_by_date.aia
(3.4 KB)
blocks
893×1254 82 KB
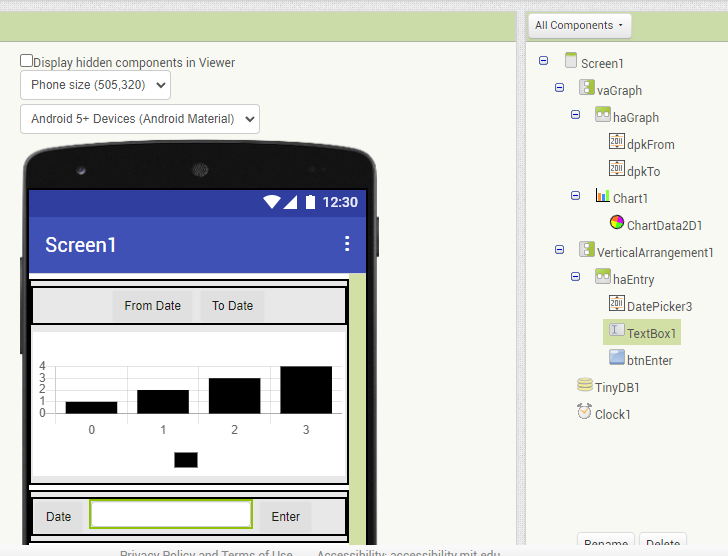
Designer
728×556 63.3 KB
Sample
306×301 11.5 KB
FAQ Section: Charts and Graphs
Converting instants to a readable date
Analytics & Statistics Tracker
show post in topic