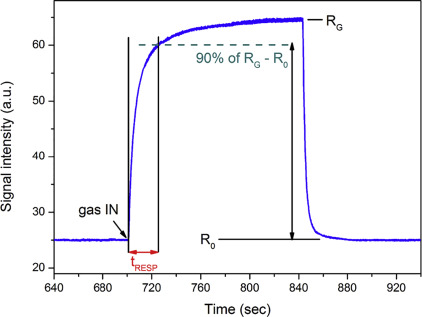
Actually, I need to control the baseline resistance and gas resistance at certain times by seconds to calculate the response time. Please see the provided image
If you plan on analyzing the variation of Rg over time, you need to accumulate a list of (Clock1.SystemTime, Rg) values.
I am unable to match your sketch variables Value_CH1 and Value_CH2 with any of your AI2 global variable names.
Is your sketch author on the same team as you?
1 Like
Actually this is not my graph but this is the same as I have for my work for resistance variation over time
Here is a sample graph over time:
You need to get your two incoming data values onto one message, ending in \n, to assure they stay in sync.

2 Likes
I can't proceed further without a good explanation of those two quantities arriving from Bluetooth into the app, and what they represent.
1 Like
Yes thanks tomorrow I will modify the app and check the Bluetooth after that I send here
Actually, thank you so much for your advice
From the ESP32 I will receive voltage that can be converted to resistance using math calculation wheatstone bridge so a the time using clock timer I can plot resistance versus time for gas sensing variation.
Since when is voltage two numbers preceded by a # sign?
And where in your blocks do you deal with the # sign?
1 Like
I measured only positive voltage as I am using ESP32 with adc component that read in range from 0 to 3.3 voltage so the voltage in will be 3.3 and out I will get from ESP32
What did you expect these blocks to accomplish?
How fond of divide by zero errors are you?
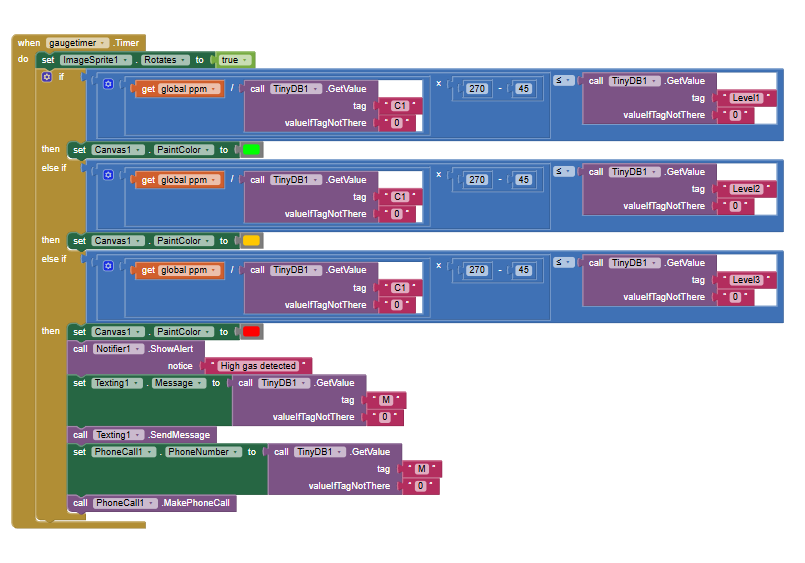
These blocks will be for the gauge, which will be connected to response and recovery times, and I converted ppm to degrees as you said earlier. At recovery time I need to get R baseline, while at response time I need to get R gas, which is R4.
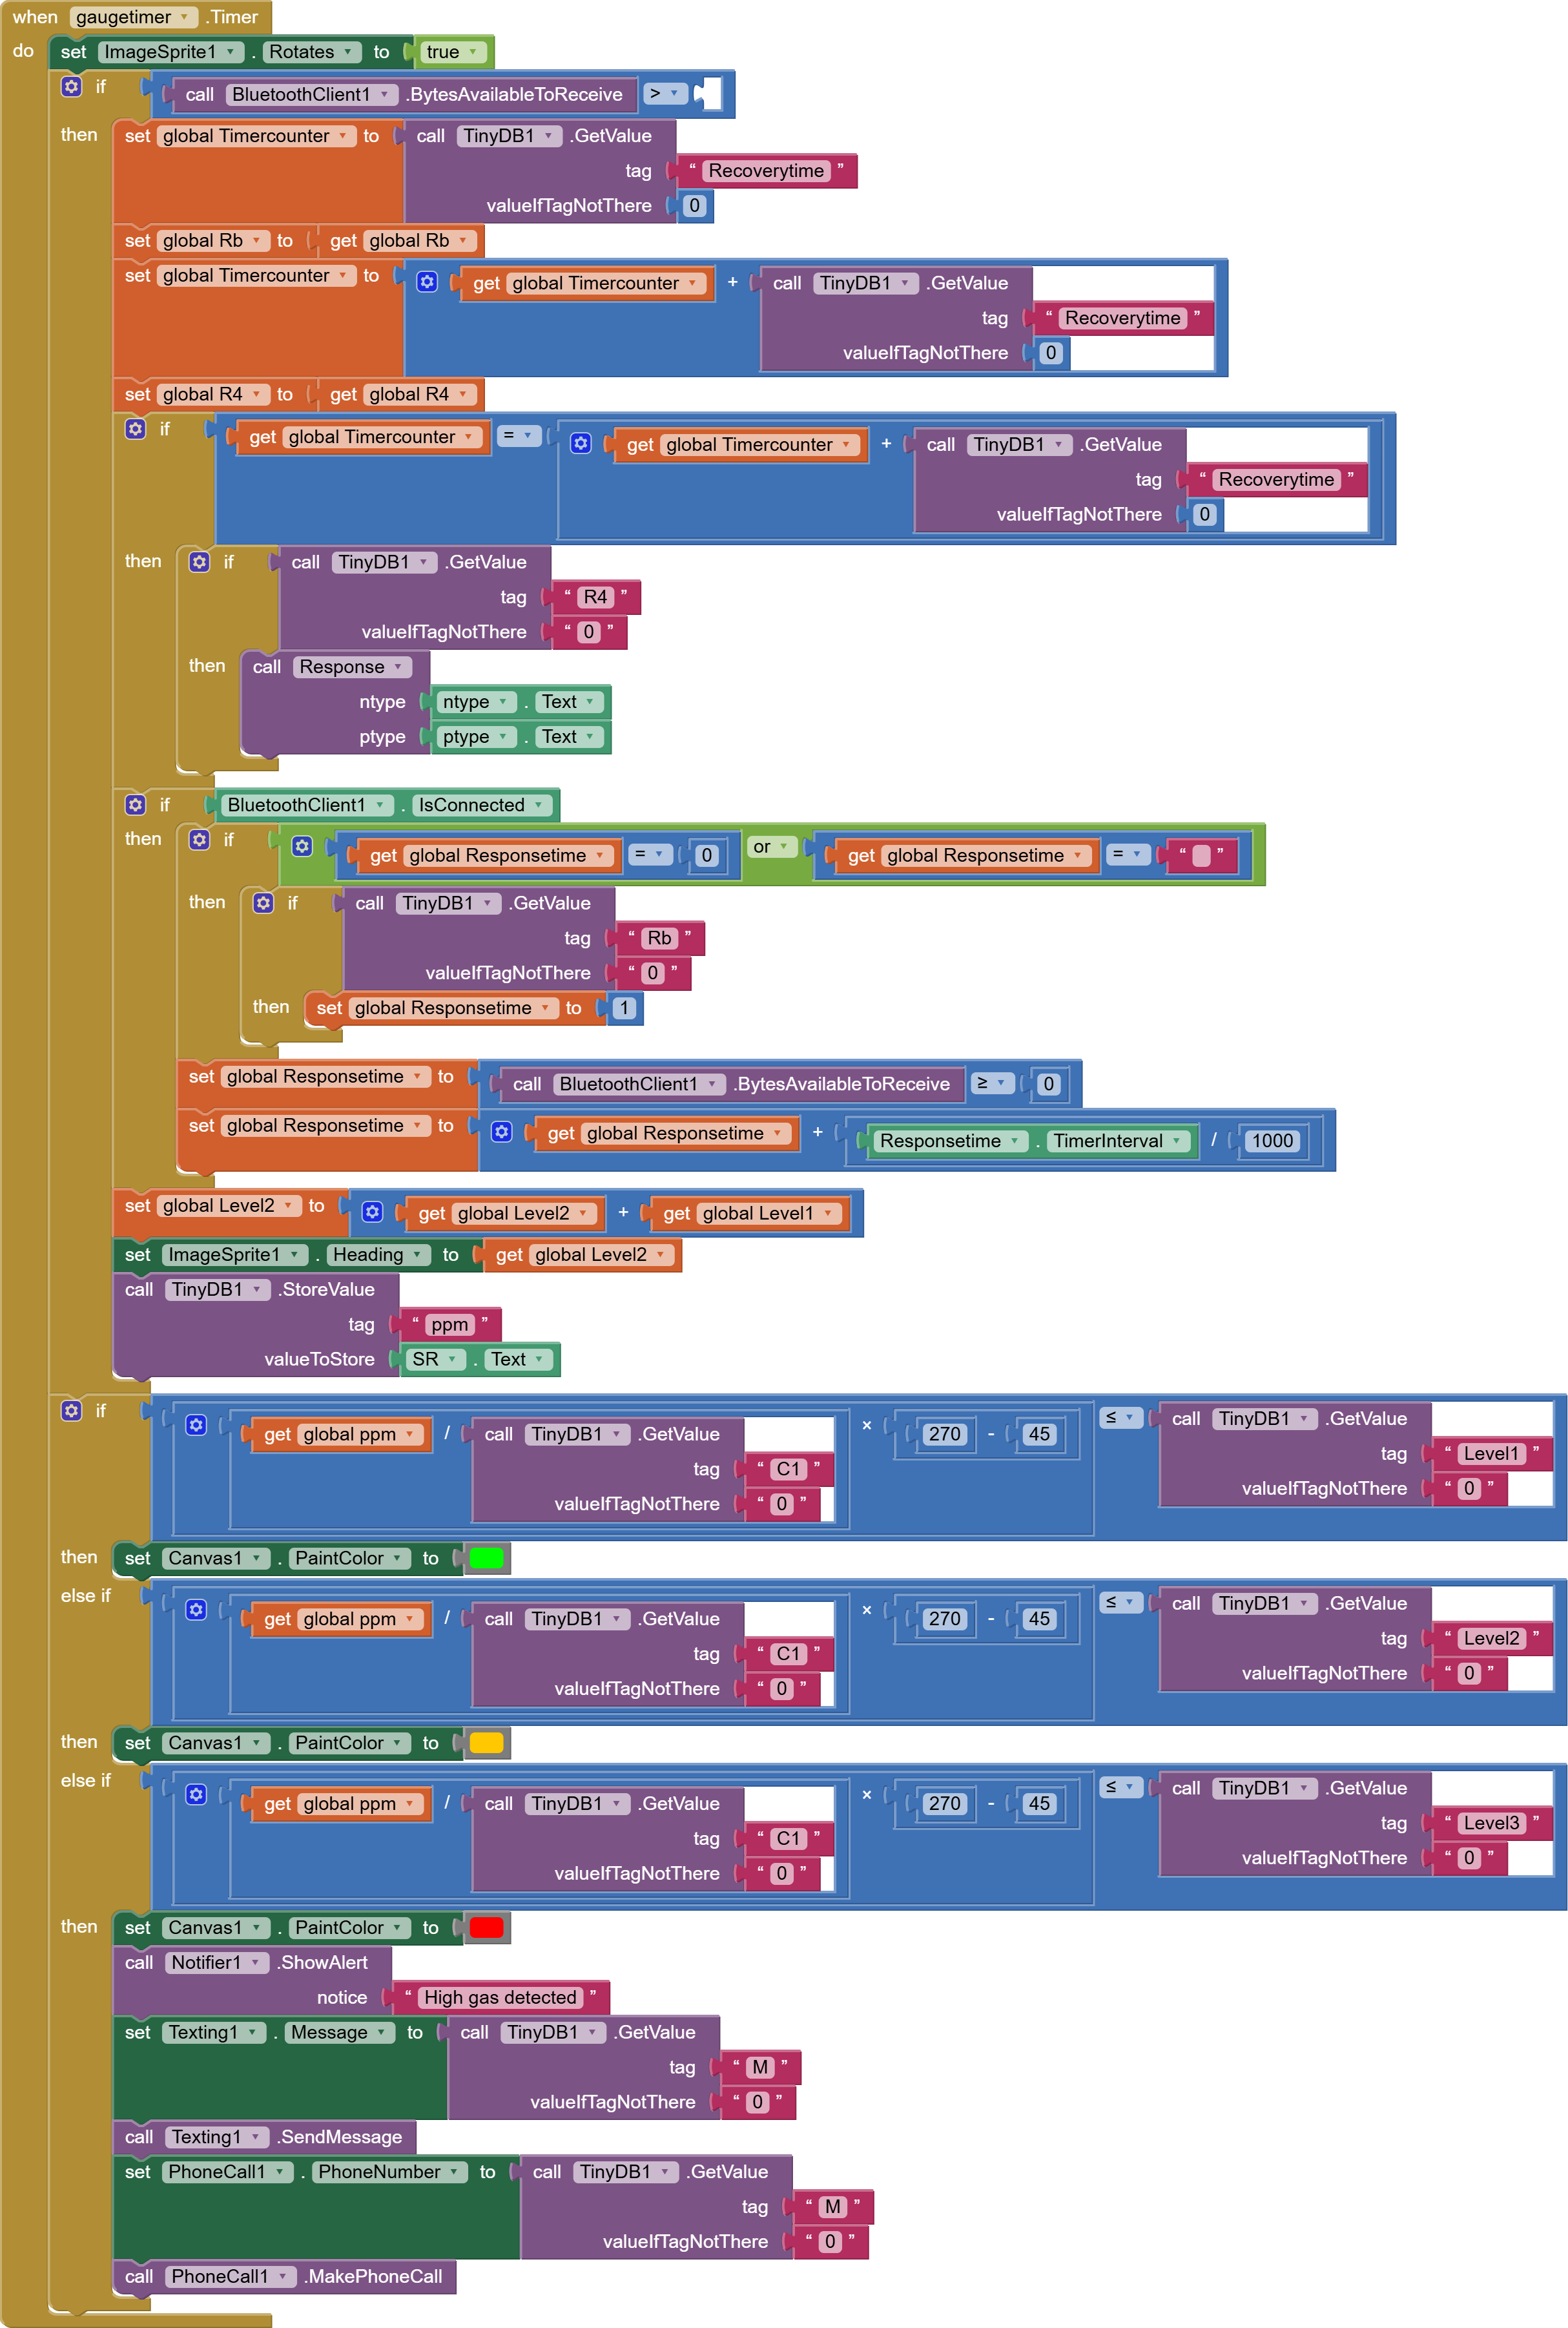
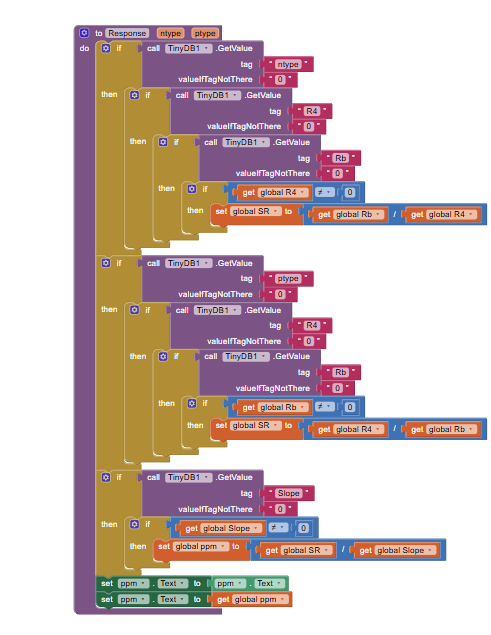
these are the calculations but still give errors
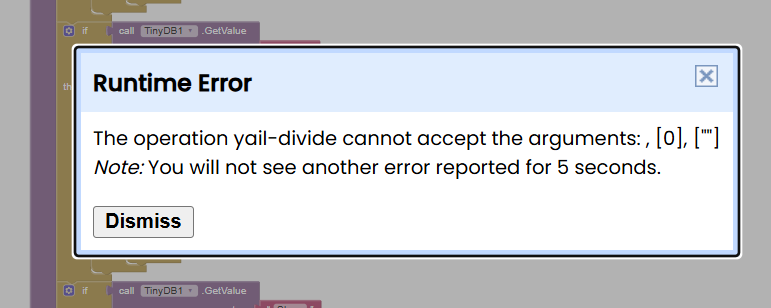
Use the Companion and the Do It facility to trace your code.
Divide by blank happens when you have not yet supplied input data, maybe because of a Clock Timer jumping the gun.
Be sure to validate your input, and use the notifier blocks that force you to hit an ok button. Alert notifiers don't cut it.
Please, I have another question.
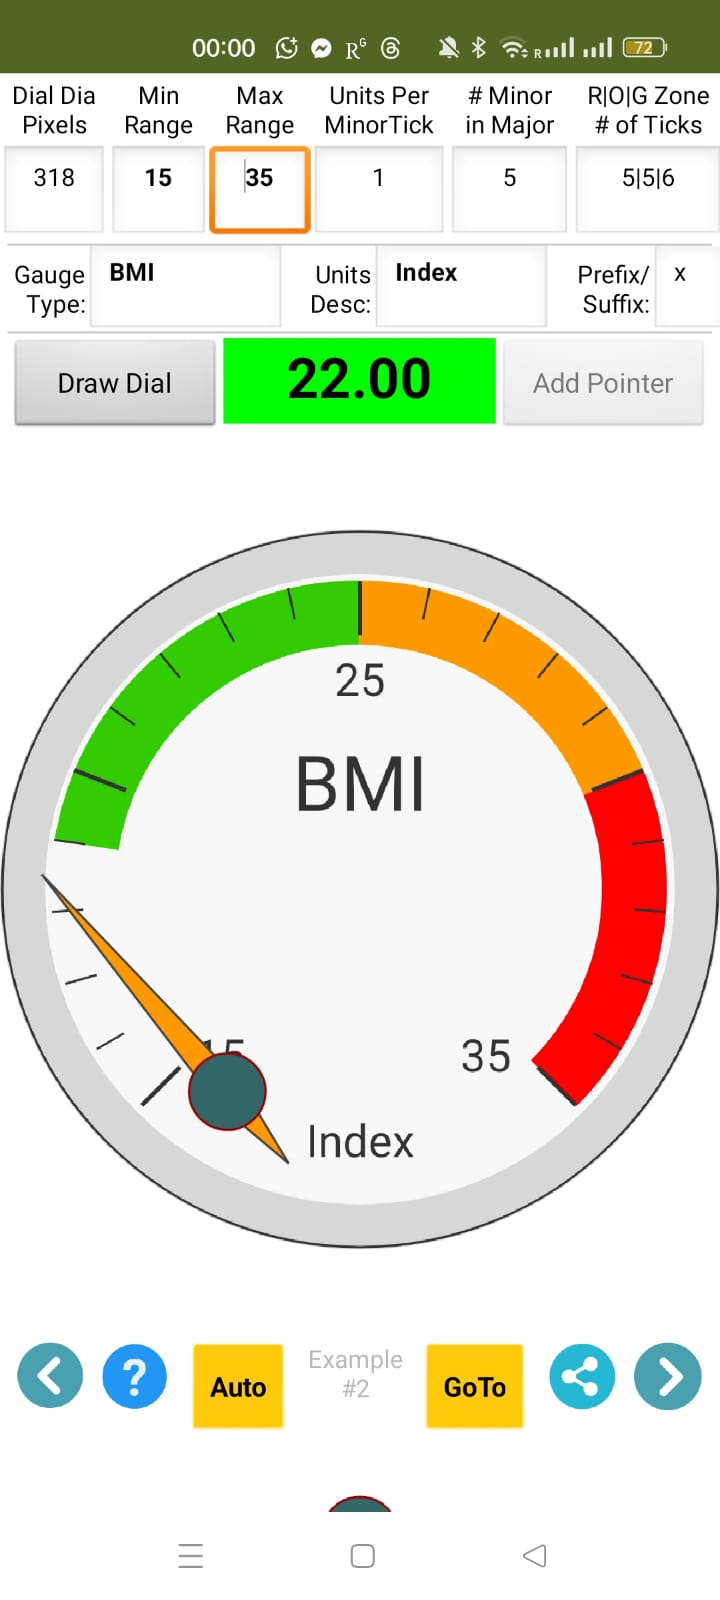
GaugeGenerator2_1.aia (73.8 KB)
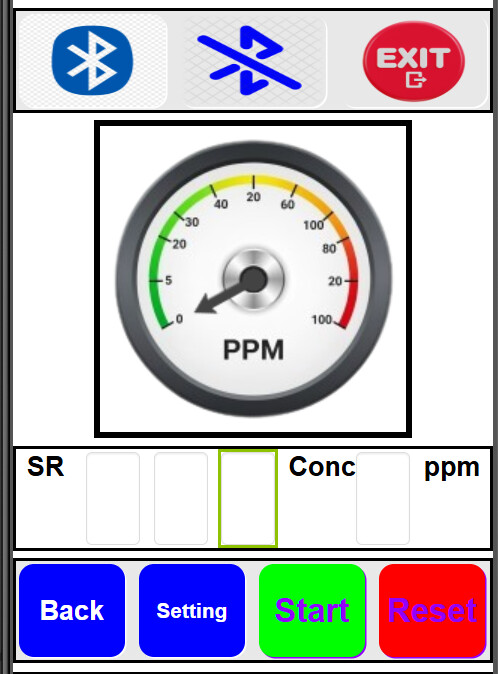
This project I downloaded from the MIT App Community, and they said to use it to make a gauge the same as they did, but in their project the gauge heading is not in the middle when rotating.
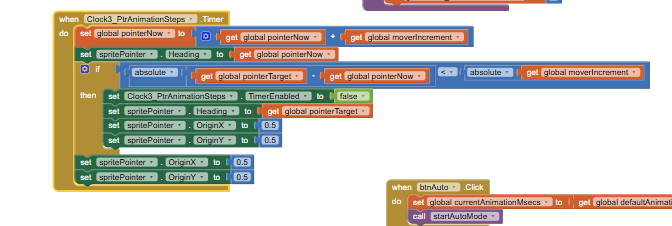
Set the sprite origins to 0.5/0.5 in the designer
Thanks for this. I did it like you said, and it is working well.
Please, I have another question: how can I adjust the clock timer to catch the baseline resistance in air and also with gas resistance?
https://www.google.com/search?sca_esv=34891ab36b11c4e5&sxsrf=AE3TifP-14o6FV4RkCcIbyF1rywnQdZOwQ:1761064121124&udm=2&fbs=AIIjpHxU7SXXniUZfeShr2fp4giZ1Y6MJ25_tmWITc7uy4KIeioyp3OhN11EY0n5qfq-zEMZldv_eRjZ2XLYc5GnVnME7glWodDcaQwvGYJtospyF4hao4VocMoniUVvlzzwRcCLYvfsjPeiuln4CZ9mxRNzMJl71rp-WEM_b89yTboF0wE9FSbwRYrSVuB6YHexvLk_d7r_74zDurdYUrhSbdL5TbQGiA&q=gas+sensor+response&sa=X&ved=2ahUKEwil7vaK27WQAxVQulYBHc64BScQtKgLegQIGRAB&biw=1536&bih=729&dpr=1.25#vhid=JolvK0OKC14AdM&vssid=mosaic
source
Please provide the download link and credit the author of that project
Taifun
1 Like
Thanks for your information. I did do this; only I am using it to learn to build my app. Next time I will share the links like you said. Thanks.
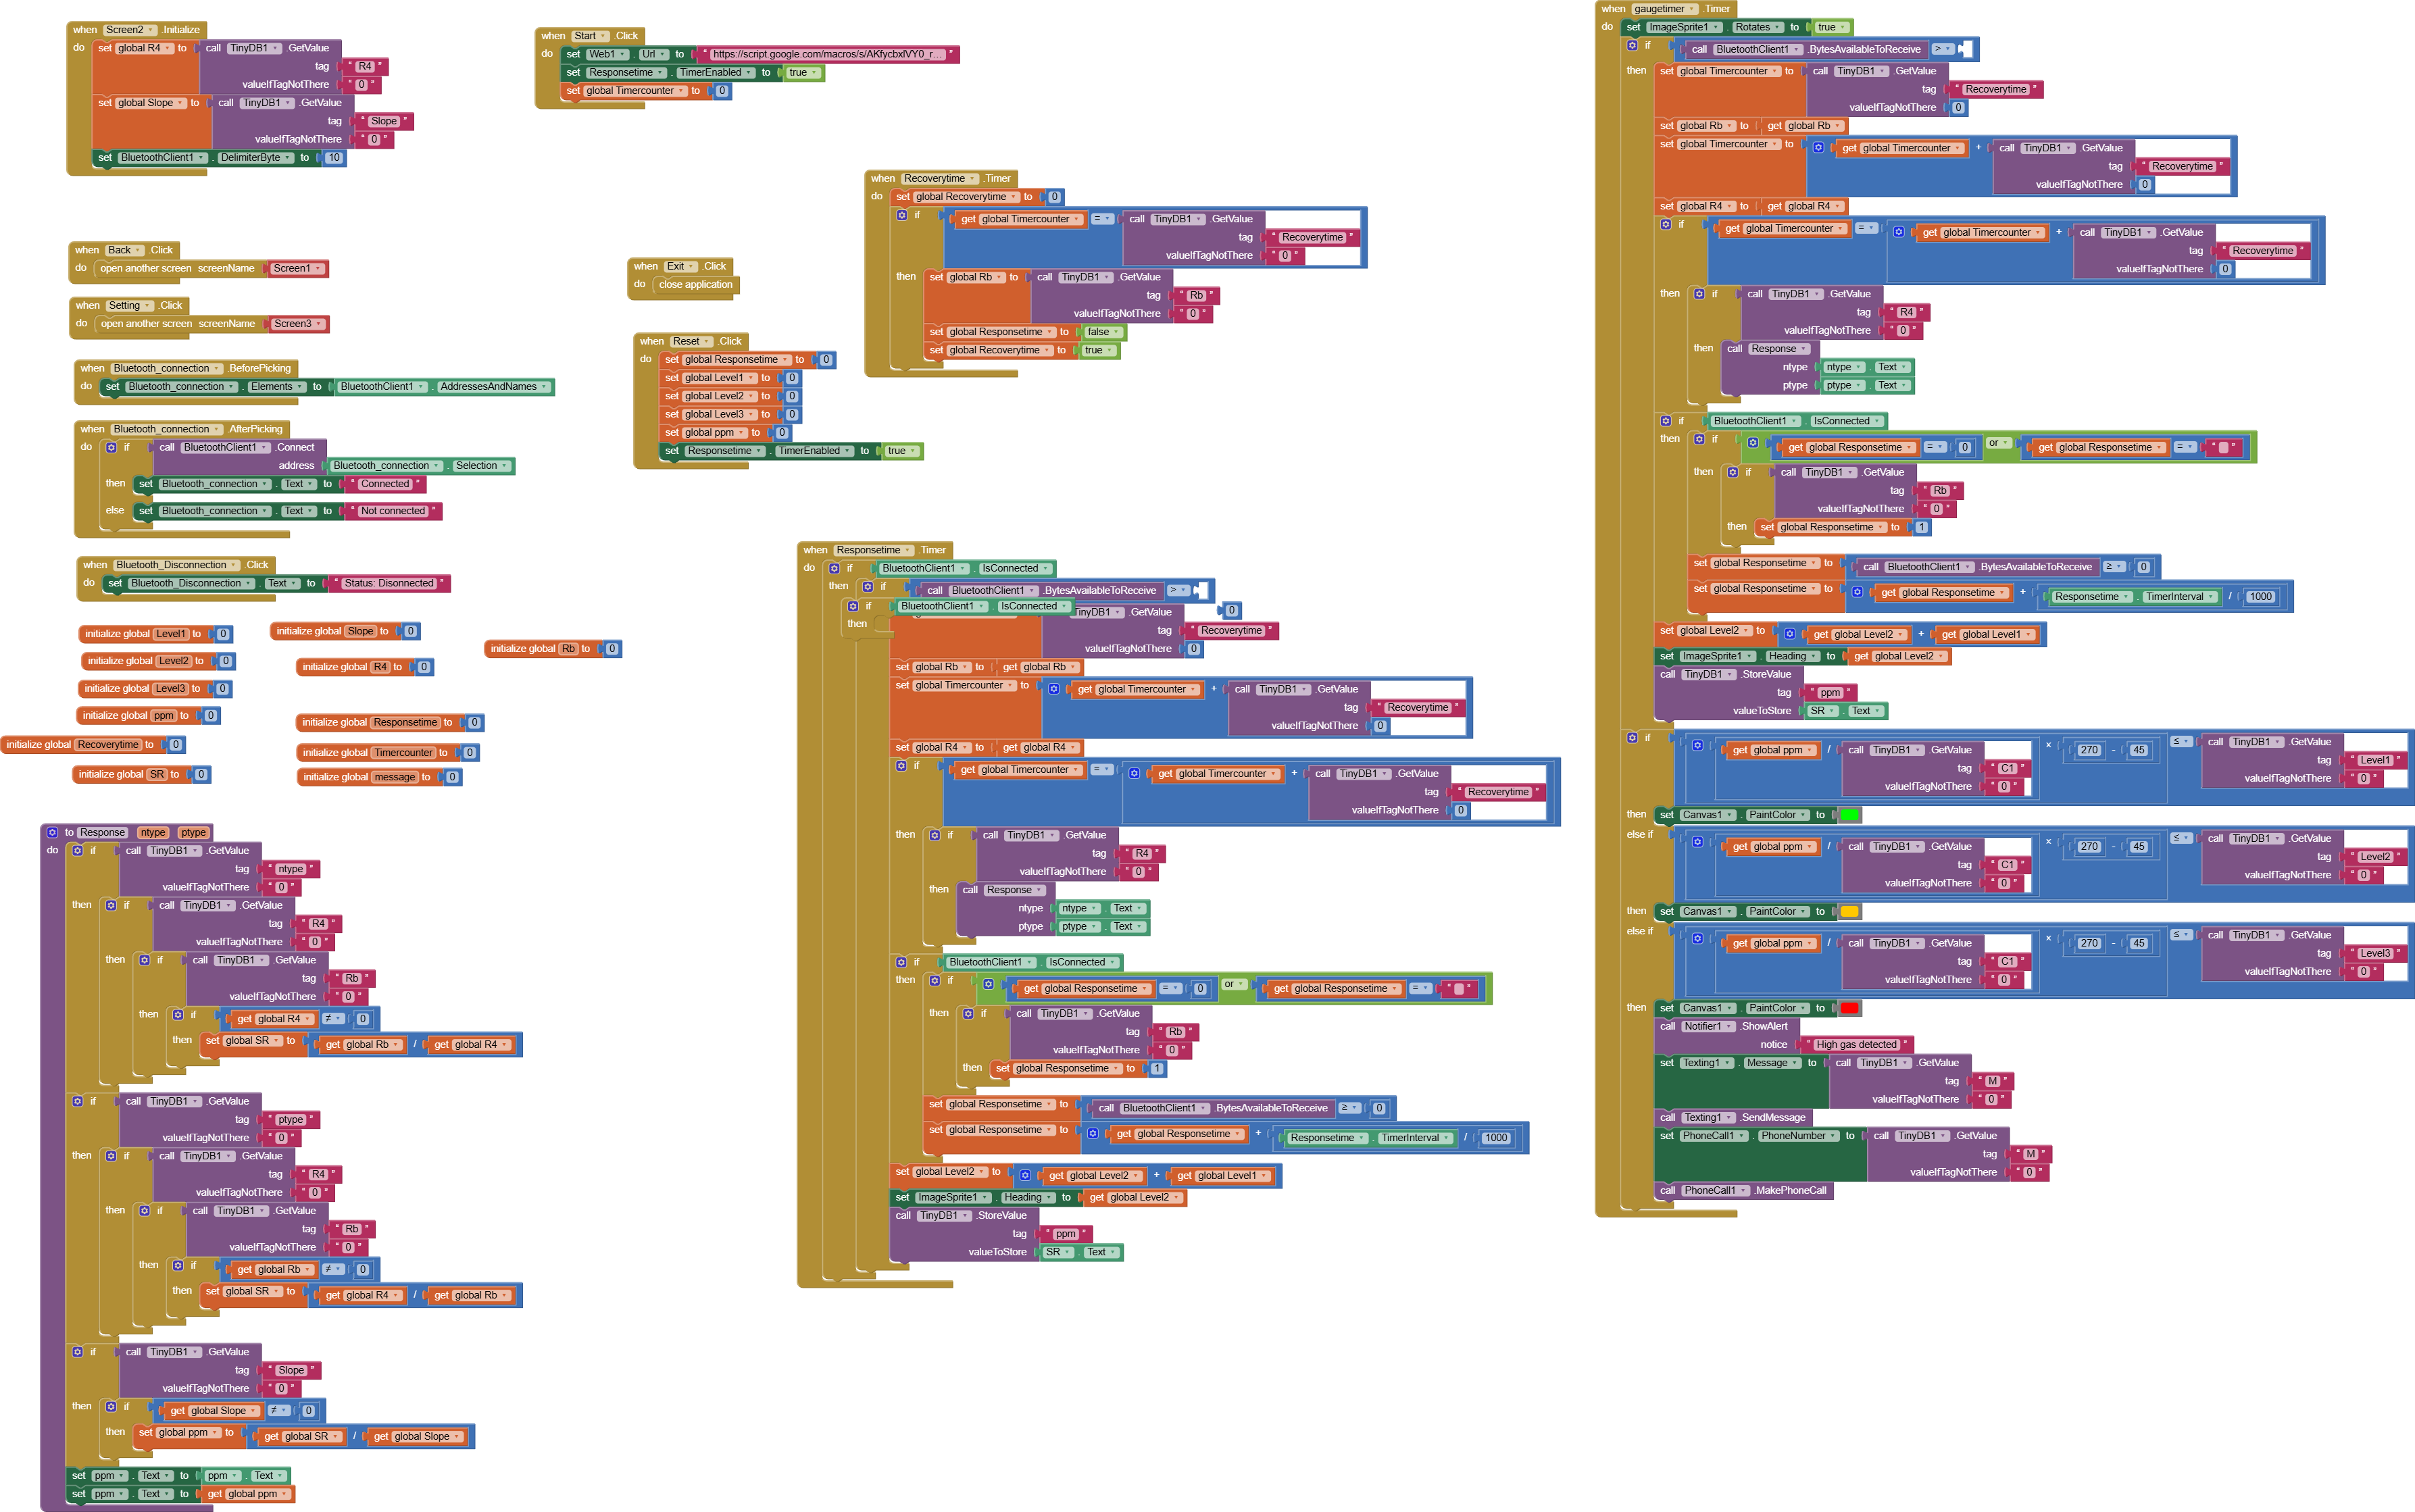
Each and every if/then test here is wrong.

You would test
IF and((is a number(ntype)) , (ntype > 0)) then
...
You never apply an if/then test to a number or a text. They are not logical true/false values, which can only be gotten from applying comparison tests.
1 Like
Please for this question. Please, I have another question: how can I adjust the clock timer to catch the baseline resistance in air and also with gas resistance?