Make a simple Canvas based gauge and display your altitude.
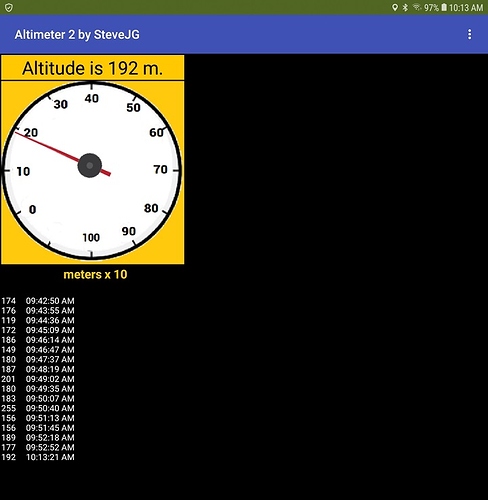
A simple home made gauge:
- uses two png images, a Canvas and an ImageSprite and
- a LocationSensor/GPS to provide elevation information
The Gauge face is an image set to the background of a Canvas. An ImageSprite is the pointer. Make the pointer with a transparent background as a png image. I am not a graphic artist; use your graphic skills to provide a more elaborate image.
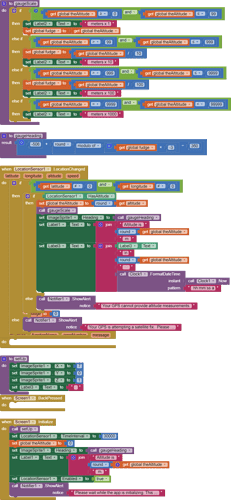
The GPS Altitude value is used in an Procedure to make the pointer point to correct values on the gauge dial. The set ImageSprite.Heading to block will orient the pointer to the correct 'meter' values. The Heading is in degrees; convert altitude values into degrees.
(http://www.appinventor.org/bookChapters/chapter17.pdf) Figure. 17-12
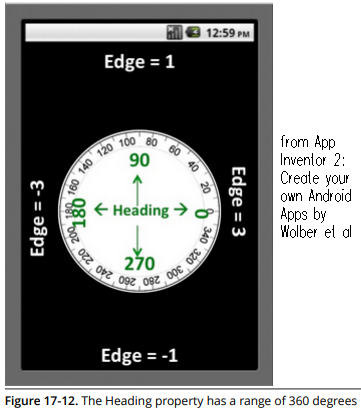
shows how the heading works. The example uses an algorithm to convert Altitude into heading values. A look-up table could be used instead. For example: 40 is converted to a 90 deg. heading , 70 to 0 deg. , 100 to 270 deg. and so on using If statements. Do what you are comfortable coding.
Use either a different meter face for 0-100, 0-1000 meters to change scales or a single meter face and provide a note next to the gauge that the gauge reads in meters x 10; meters x 100 etc. ( shown in this example). Code to display a different labeled Gauge face or to provide the meter magnification. Use If…then…else statements. Trial and error is required to ‘calibrate’ the meter (The example uses a modulo Math routine like this
The variable Fudge is variously the Altitude divided by 10 or 100 or 1000 depending on the whether the Altitude is less than 1000 meters and the gauge’s scale. Why 360? There are 360 degrees in a circle. Experiment.
The Procedure gaugeHeading might work with your home made gauge image and pointer. It works with the provided images. Will the algorithm be compatible with your images? That depends on your Canvas and image sizes and how many major ticks the gauge displays. Avoid headaches, set Height and Width of the Canvas to pixels.
Use common sens using the GPS altitude 'measurements'. Do not use this app to determine the altitude of an aircraft. Altitude readings are not precise. The LocationSensor attempts to update altitude every 30 seconds. More frequent updates might be possible only if the GPS confirms a fix using three satellites. Realistically, a satellite fix won't happen more frequently than about every 20 seconds. The altitude reported is not the present altitude; it is the altitude determined when the LocationSensor.LocationChanged event fires. This method cannot provide second by second changes in altitude.
A Clock timestamps the calculated elevation about once every thirty seconds. A feature in the app provides a history of the elevations the GPS reports from the satellite fixes it obtains changes over several minutes. For testing, the Android is resting on a desk, not moving; the reported elevation CHANGES anyway. Is this normal? Yes. The altitude is influenced by the 'quality' of the satellite fix (determined by how many receive channels your GPS has available, the number of satellites that are usable on the Android's 'view' of the sky etc.) The variations in elevation demonstrates the altitude value determined is reasonable but not totally reliable.
The Blocks
The example aia is called AnalogAltimeter AnalogAltimeter.aia (52.5 KB) strong text
Homemade meter face and pointer included in Media with the aia.
============================
Use a GoogleChart Gauge to display your altitude.
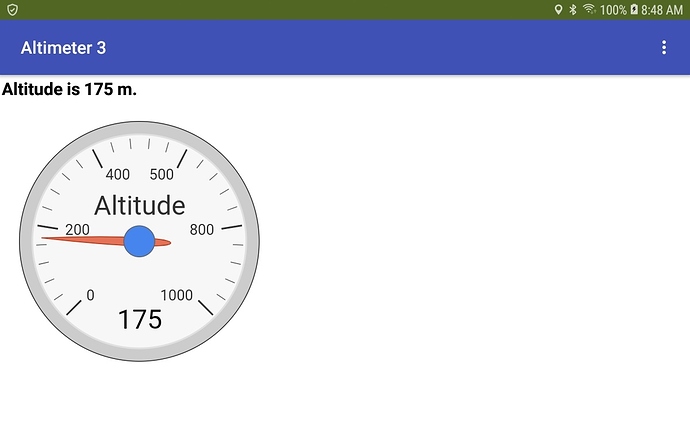
A GoogleChart Gauge:
- uses a GoogleChart Gauge html and a javascript loader stored in Media and a WebViewer
- a LocationSensor/GPS to provide elevation information
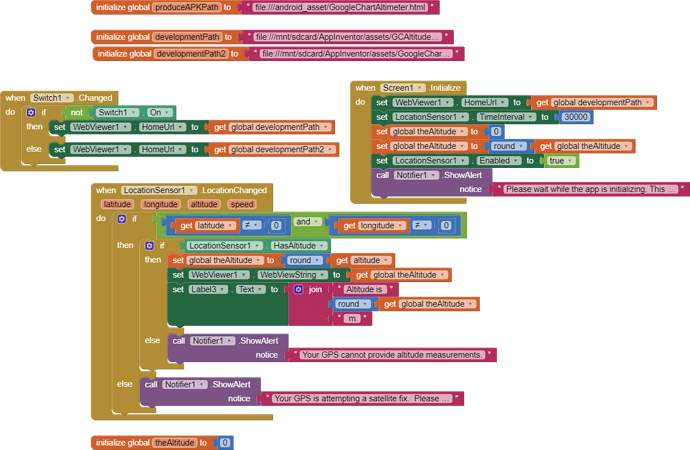
This example seems simpler to code than creating your own gauge but it is not. This app requires javascript skills to 'construct' the gauge face. Designing the gauge face requires experimentation. A benefit is the AI2 code to implement the javascript is relatively simple. set WebViewer1.WevViewString to round get altitude provides an updated altitude elevation whenever the LocationChanged event occurs.
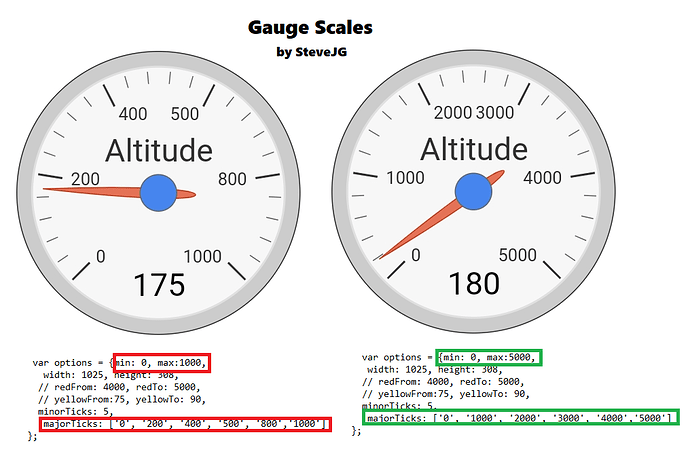
The example can switch between a 0-1000 m gauge scale and a 0-5000 m scale. The code required in the html is
                            var options = {min: 0, max:1000,
                              width: 1025, height: 308,
                             // redFrom: 4000, redTo: 5000,
                             // yellowFrom:75, yellowTo: 90,
                             minorTicks: 5,
                              majorTicks: ['0', '200', '400', '500', '800','1000']
                           };
for the smaller elevations. Use
                             var options = {min: 0, max:5000,
                              width: 1025, height: 308,
                             // redFrom: 4000, redTo: 5000,
                             // yellowFrom:75, yellowTo: 90,
                             minorTicks: 5,
                              majorTicks: ['0', '1000', '2000', '3000', '4000','5000']
                           };
to display the larger elevations.
How can you displace various scales? A simple way is to use two different html files; one for each gauge calibration and switch between them as appropriate. The example uses a Switch.
The Blocks
The aia is called Altimeter3.aia. Altimeter3.aia (47.2 KB)
You probably will need the aia provided by @Pinback in post 3$ for compiling on Android 11+
Uses highly modified html javascriipt posted in Forum by Chris showing an example of a GoogleChart Pressure gauge. Html's for two gauge faces and a javascript loader are included in Media with the aia.
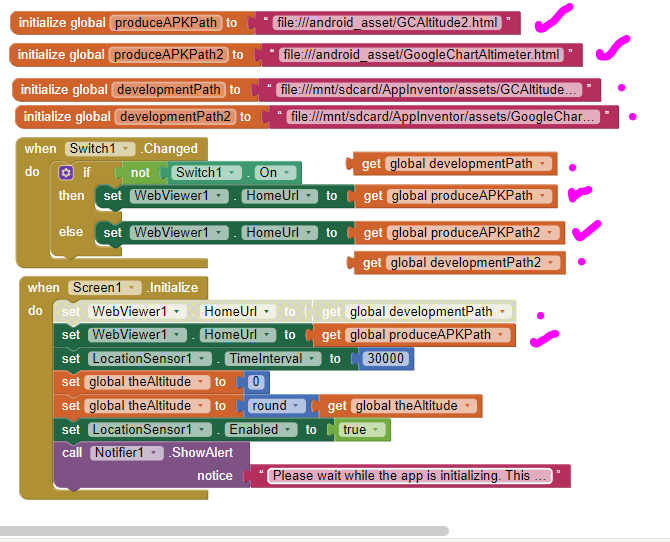
Compile an APK or develop using Companion
When you are developing, be sure use the developmentPath Blocks (shown with a dot in the image below); when ready to produce an apk, substitute the produceAPKPath Blocks (shown with check marks) for the development blocks. If you do not do this, your app will not compile. The default in the aia files is to use the developmentPath Blocks. Change Blocks in the Screen1.Initialize and when Switch1.Changed event handlers.
Regards,
Steve
