MIT App Inventor Community
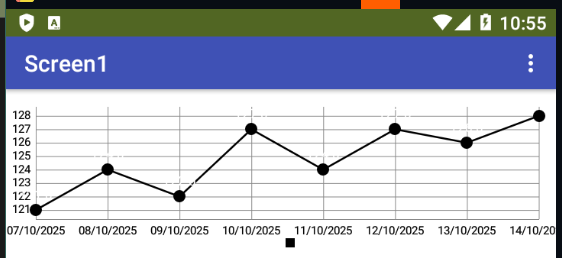
Converting instants to a readable date
MIT App Inventor Help
ABG
October 8, 2025, 3:58am
16
image
562×258 20.6 KB
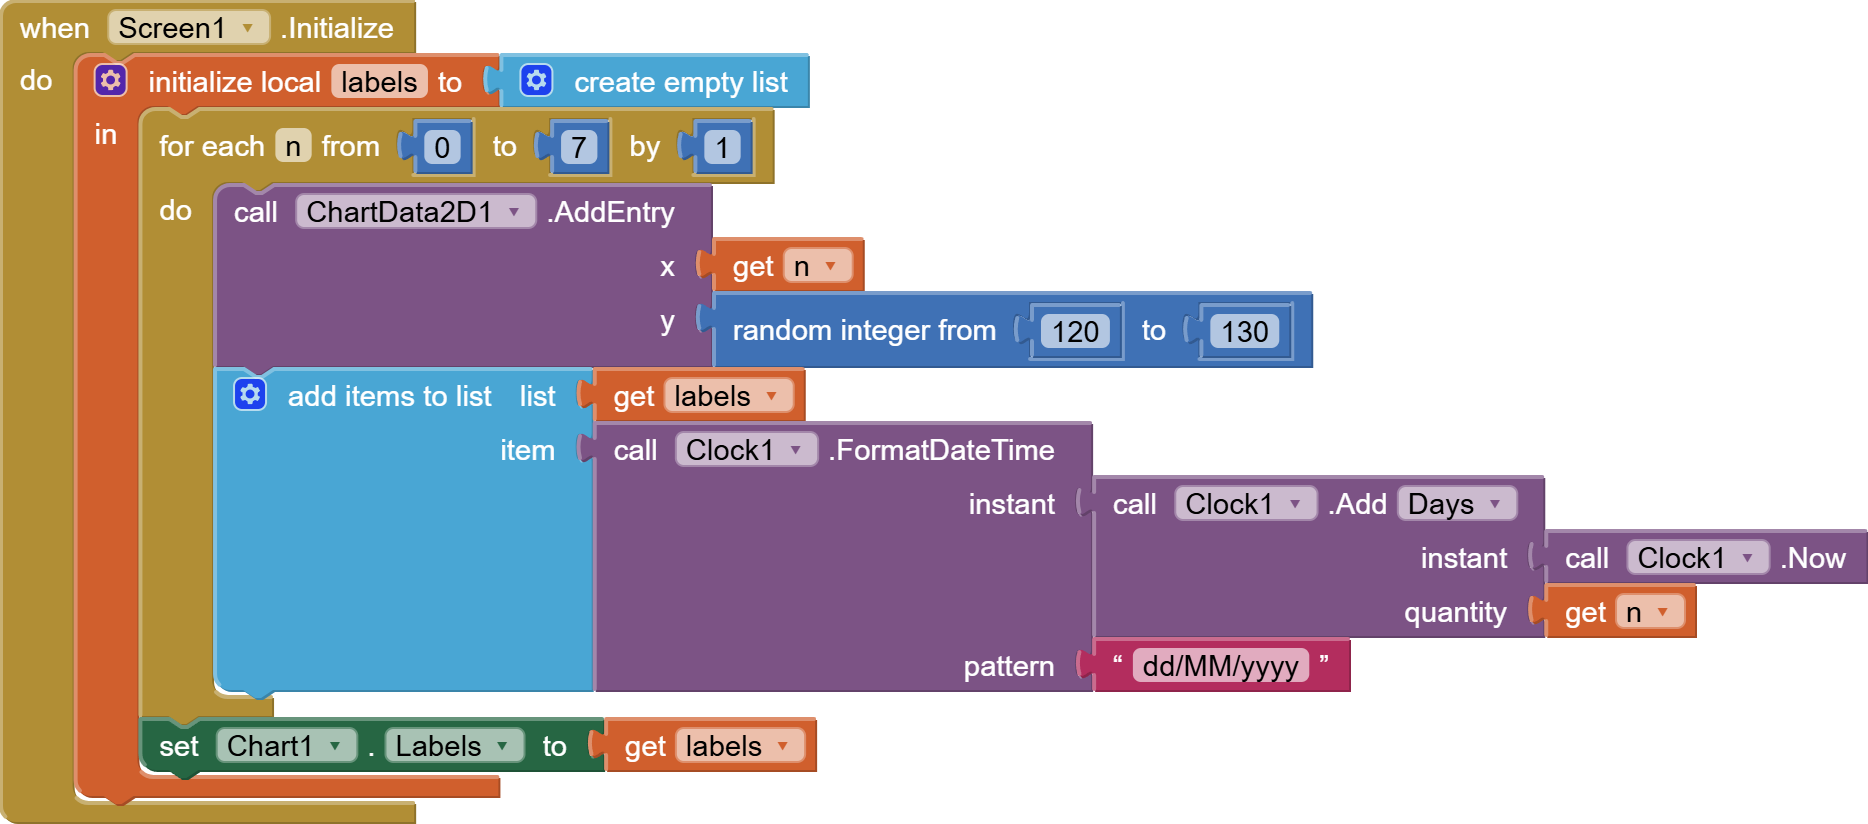
blocks
1868×824 110 KB
week_chart.aia
(2.3 KB)
How about this?
FAQ Section: Charts and Graphs
show post in topic