Hi everyone! I'm developing a project that sends temperature values from the ESP32 to my application via bluetooth. Do you have any examples of creating graphs that change in real time according to values received?
Thank you for your support. Is there any example or any API for 3D graphics?
Learn to walk before trying to fly.
Is your data collection finished and working?
I used the example: How to connect bluetooth data to Chart component, dynamic chart
Everything worked perfectly. however, when I changed my code to send values read from my ESP32's ADC, the values appear divergent. For example, in the example code, values between 5 and 95 are sent. In my application, values from 0 to 4095, or perhaps higher values, will be sent. What parameters do I need to change in my application to be able to visualize these values on the graph correctly?
Post your updated sketch and .aia file here.
My sketch:
#include "BluetoothSerial.h"

String device_name = "ESP32-BT-Slave";

#if !defined(CONFIG_BT_ENABLED) || !defined(CONFIG_BLUEDROID_ENABLED)
#error Bluetooth is not enabled! Please run `make menuconfig` to and enable it
#endif

#if !defined(CONFIG_BT_SPP_ENABLED)
#error Serial Bluetooth not available or not enabled. It is only available for the ESP32 chip.
#endif

BluetoothSerial SerialBT;

#define CALIBRA 25
#define TENSAO1 33
#define TENSAO2 32

int tensao1 = 0;
int tensao2 = 0;

int p2 = 0; //
int p1 = 0; //

void setup() {

  Serial.begin(115200);
  SerialBT.begin(device_name); //Bluetooth device name

  pinMode(CALIBRA, INPUT);
  pinMode(TENSAO1, INPUT);
  pinMode(TENSAO2, INPUT);


}

void converte() {
  tensao1 = 0, tensao2 = 0;
  for(int i = 0; i < 10; i++){
  tensao1 += 0.8247 * analogRead(TENSAO1);
  tensao2 += 0.8247 * analogRead(TENSAO2);
  delay(10);
  }
  tensao1 /= 10;
  tensao2 /= 10;

  //Serial.printf("tensão1 = %imV e tensao2 = %imV\n", tensao1, tensao2);
}
/*
void calibra () {
  p1 = 0;
  p2 = 0;

  for(int i = 0; i < 20; i++){
    p1 += analogRead(TENSAO1);
    p2 += analogRead(TENSAO2);
    delay(10);
  }
  p1 = (p1 / 20);
  p2 = (p2 / 20);

  Serial.printf("calibradas: p1 = %i e p2 = %i\n", p1, p2);
}
*/
void loop() {

  if(!digitalRead(CALIBRA)){
    Serial.println("calibração...");
    delay(200);
    calibra();
  }
   converte();
   String t = "t:" + String(tensao1);
   String p = "p:" + String(tensao2);
   //Serial.printf("tensao1: %s\n", String(tensao1));

   SerialBT.println(t);
   SerialBT.println(p);
   delay(100);

}
.aia file:
Chart_and_bluetooth_ESP32.aia (40.9 KB)
I'm starting to develop applications now. In my work, it will be necessary to create some projects using this tool. Do you recommend any courses or materials for me to expand my knowledge about the platform?
Divergent from what?
You might set your AI2 Clock Timer faster than the transmitting clock timer (50 ms vs 100 ms), to avoid backlogs.
Same for your BlueTooth Client Polling rate:
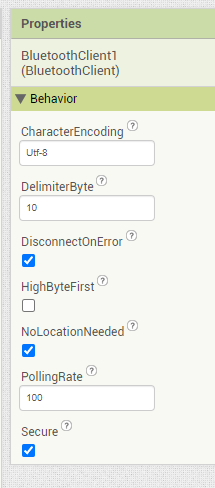
If your t and p values differ in scale greatly, it's unrealistic to expect a single Range to adequately display both values.
You might have to rescale one of the values upstream, or just save the data as it arrives in a list, for post processing before graphing it from another list.
1 Like
Thanks for the assistance. I carried out the test using the example you gave me, creating a graph with the values sent by my ESP32. It worked correctly! My question would be: is there a simple way to implement a three-dimensional graph? Because in another application that I will need to make, it will refer to data from a sensor that captures an electromagnetic field. Then you will need to print this data on the graph
The simplest way is to Google three-dimensional graph - Google Search
and devise a way to pass your data to any one of those programs hungry for data.
If you save your data as a three column table, you can convert it to a CSV Table stream and pass it through the Sharing component block that shares the stream of data without its feet touching the File System.
Your phone has many apps hungry for that data stream, like editors, mail programs, spreadsheets, etc.
The idea would be to use a Google API that builds three-dimensional graphics and use the sharing block to send my data?
Is there any example where this sharing of a variable or a table is done with the sharing block?
No, my idea was to do a Google Search for any kind of three dimensional graphics package.
Why restrict yourself to Google when such packages and services are a dime a dozen?
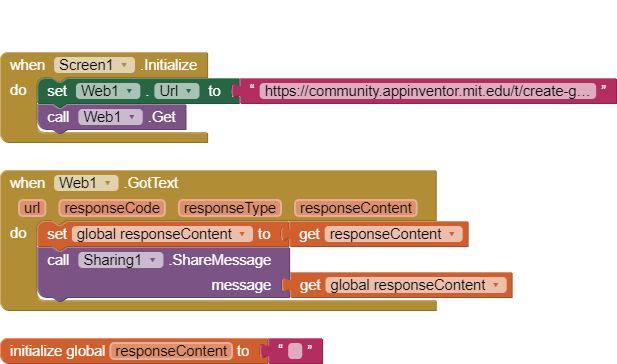
download_and_share.aia (2.3 KB)
For lack of imagination, this sample downloads and shares one of the posts in this thread.
That explains all the HTML.
Run it on your phone, not an emulator, to see all those other apps hungry for data.
So let me see if I understood correctly...
The idea is to find a online three dimensional graphics package , so that my application can access this url and send the input data to be plotted. Correct?
I was unsuccessful using this example. The application opens but nothing appears on the screen.
Alternatively, look for a JavaScript library that can view the 3D graph in the AI2 WebViewer.
It all depends on your plans for the app.
Is this a one shot deal?
Or is this for publication?
Who do you want viewing the graphs, and where?
I'll try to explain it briefly to you:
My project consists of a device that has sensors to capture the intensity of the electromagnetic field. This information will be sent from my ESP32 to my app via bluetooth. My application needs to take this data and plot it in the form of a three-dimensional graph in real time, such as a surface graph.
Currently, as a test, I am sending two voltage data read on pins from my ESP32 to my application via bluetooth and plotting it on a 2D graph, using the blocks and the example you provided me. However, I now need to move on to trying to plot a three-dimensional graph.
At the moment, this application will just be a prototype for testing, but in the future, if the concept is approved, the idea is to be an application for a final product.
Based on your future plans, an online API looks inappropriate.
That leaves you with
- Native Chart component
- Canvas
- JavaScript in WebViewer
The native Chart component can be fed with three ChartData subcomponents. It might not look 3D, but it would be easiest.
The Canvas component requires scaling and transformation of its input if you intend to draw your own 3D graphs. Others have done this in 2D before the Chart component arrived. You will be the first to do 3D. See Matrix Multiplication in Blocks for a free matrix multiplication library you can use for this, if you have the math skills.
A Javascript based solution would be new to this board. Let us know what you find.
Could you explain to me how this is done offline on other app development platforms? Is the design done via source code or is a library or something else imported?
Could you provide me with an example of how the 2D graph was created in Canvas?
Do you think it would be worth it for me to do this or perhaps I should learn to develop on another platform that would have this capability?
See the Blocks Based on Canvas section of
I have inadequate information to judge that.
(Insert joke about the fellow whose tool box contained only a phone book and credit card.)