I have turned off Windows Defender examination of aia files, so I can examine your aia file.
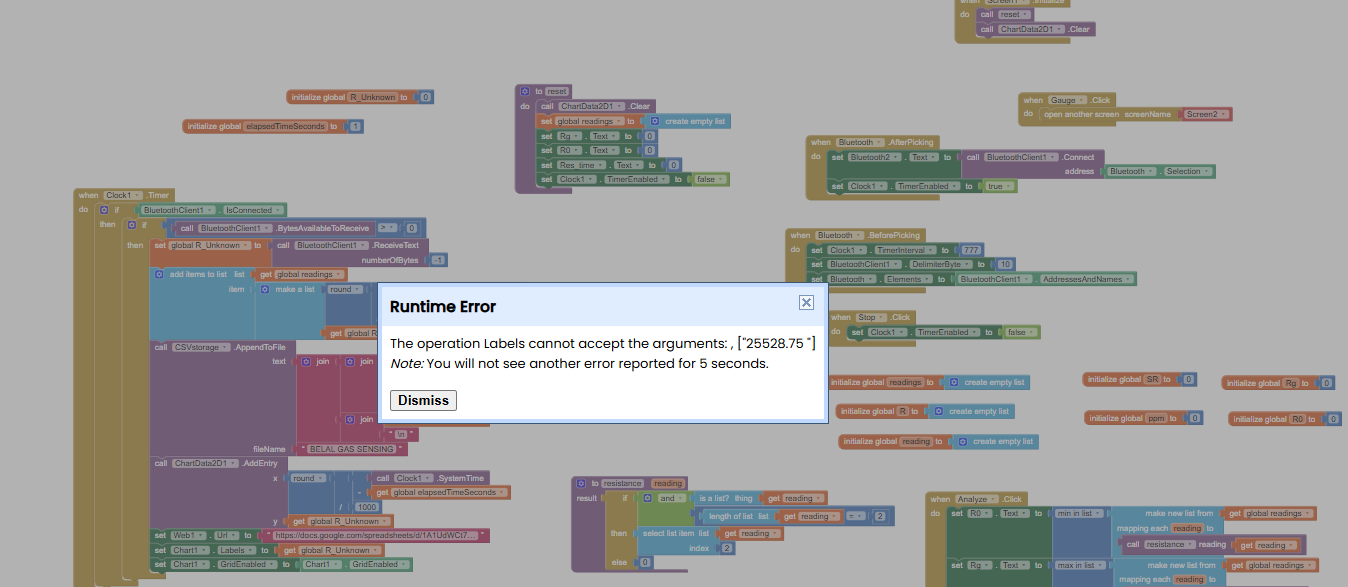
Here is a set of blocks I must change, for readability and correctness:
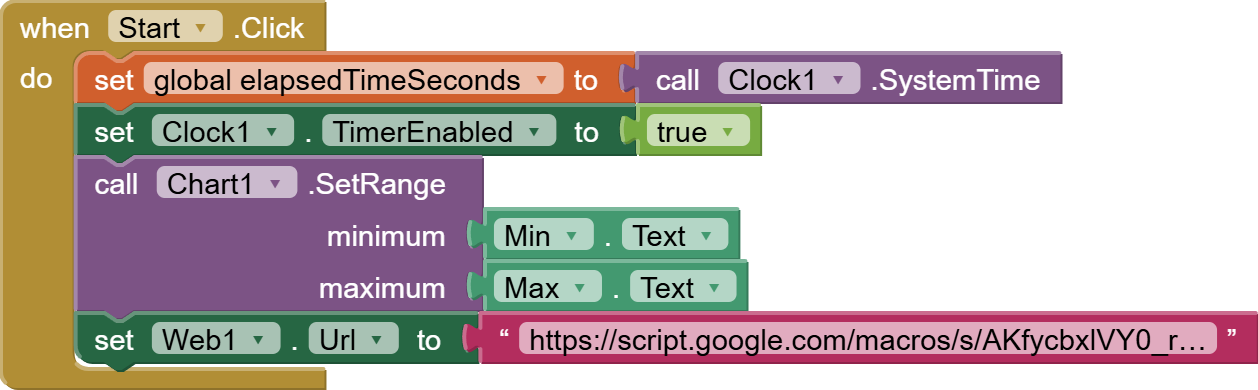
old:

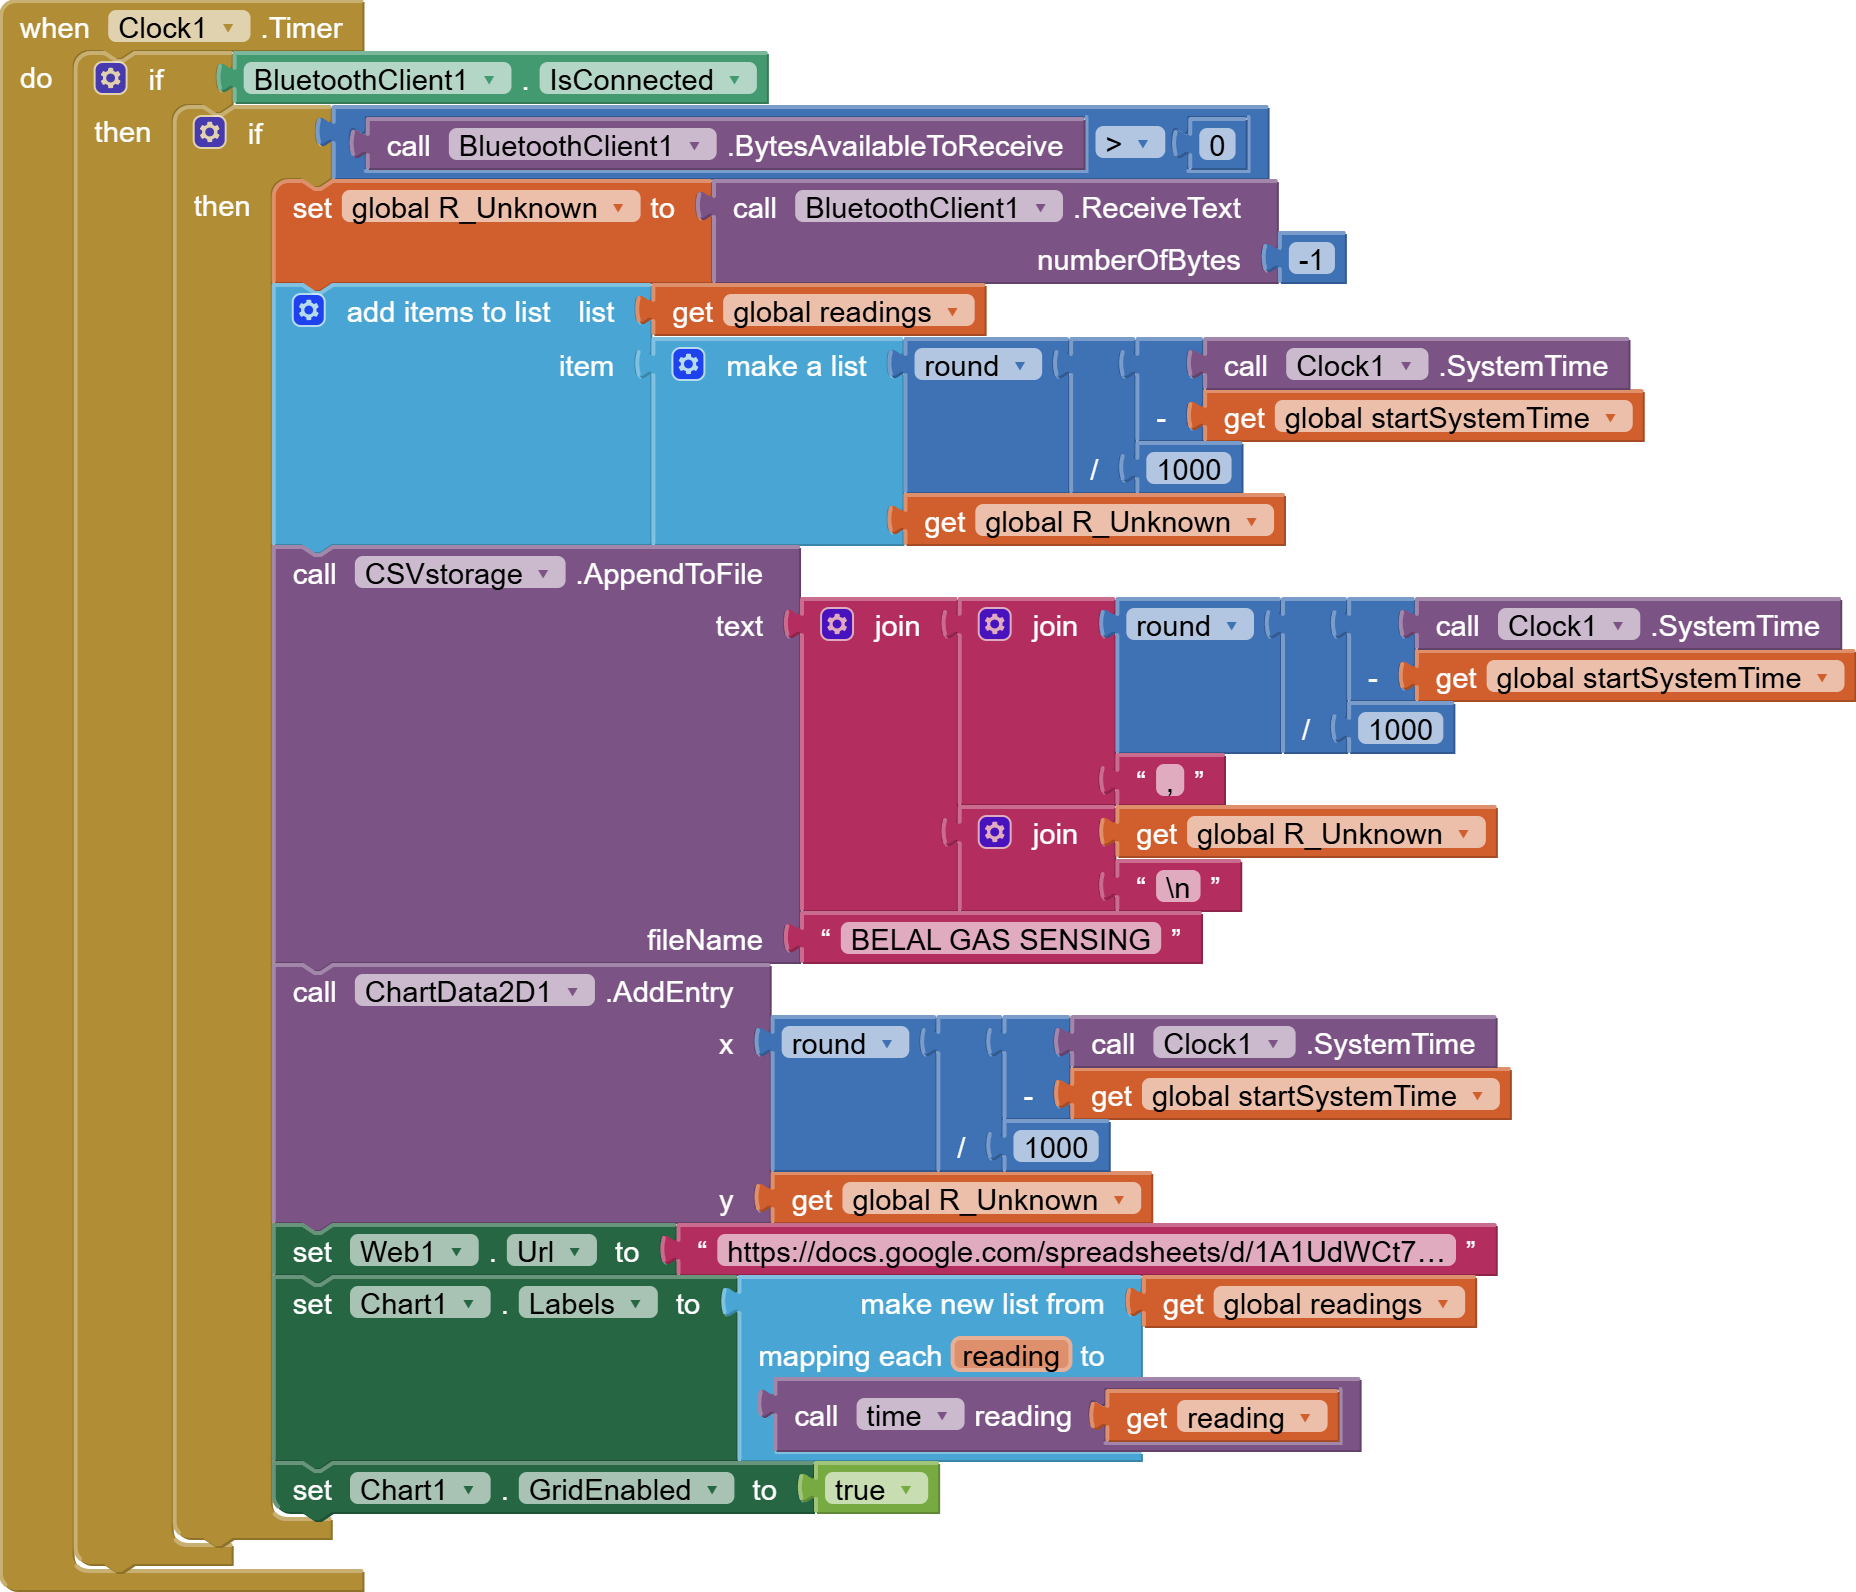
new:

Do you see the difference between elapsed time and absolute System time?
Elapsed means you have subtracted start time from end time to get the difference.
But that is not what is being stored in this variable, as you will see further down.
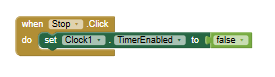
old:
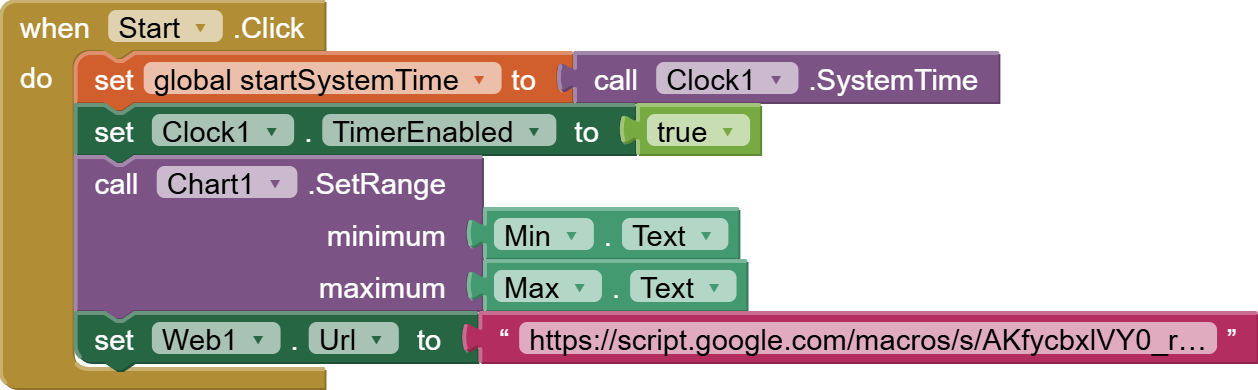
new:
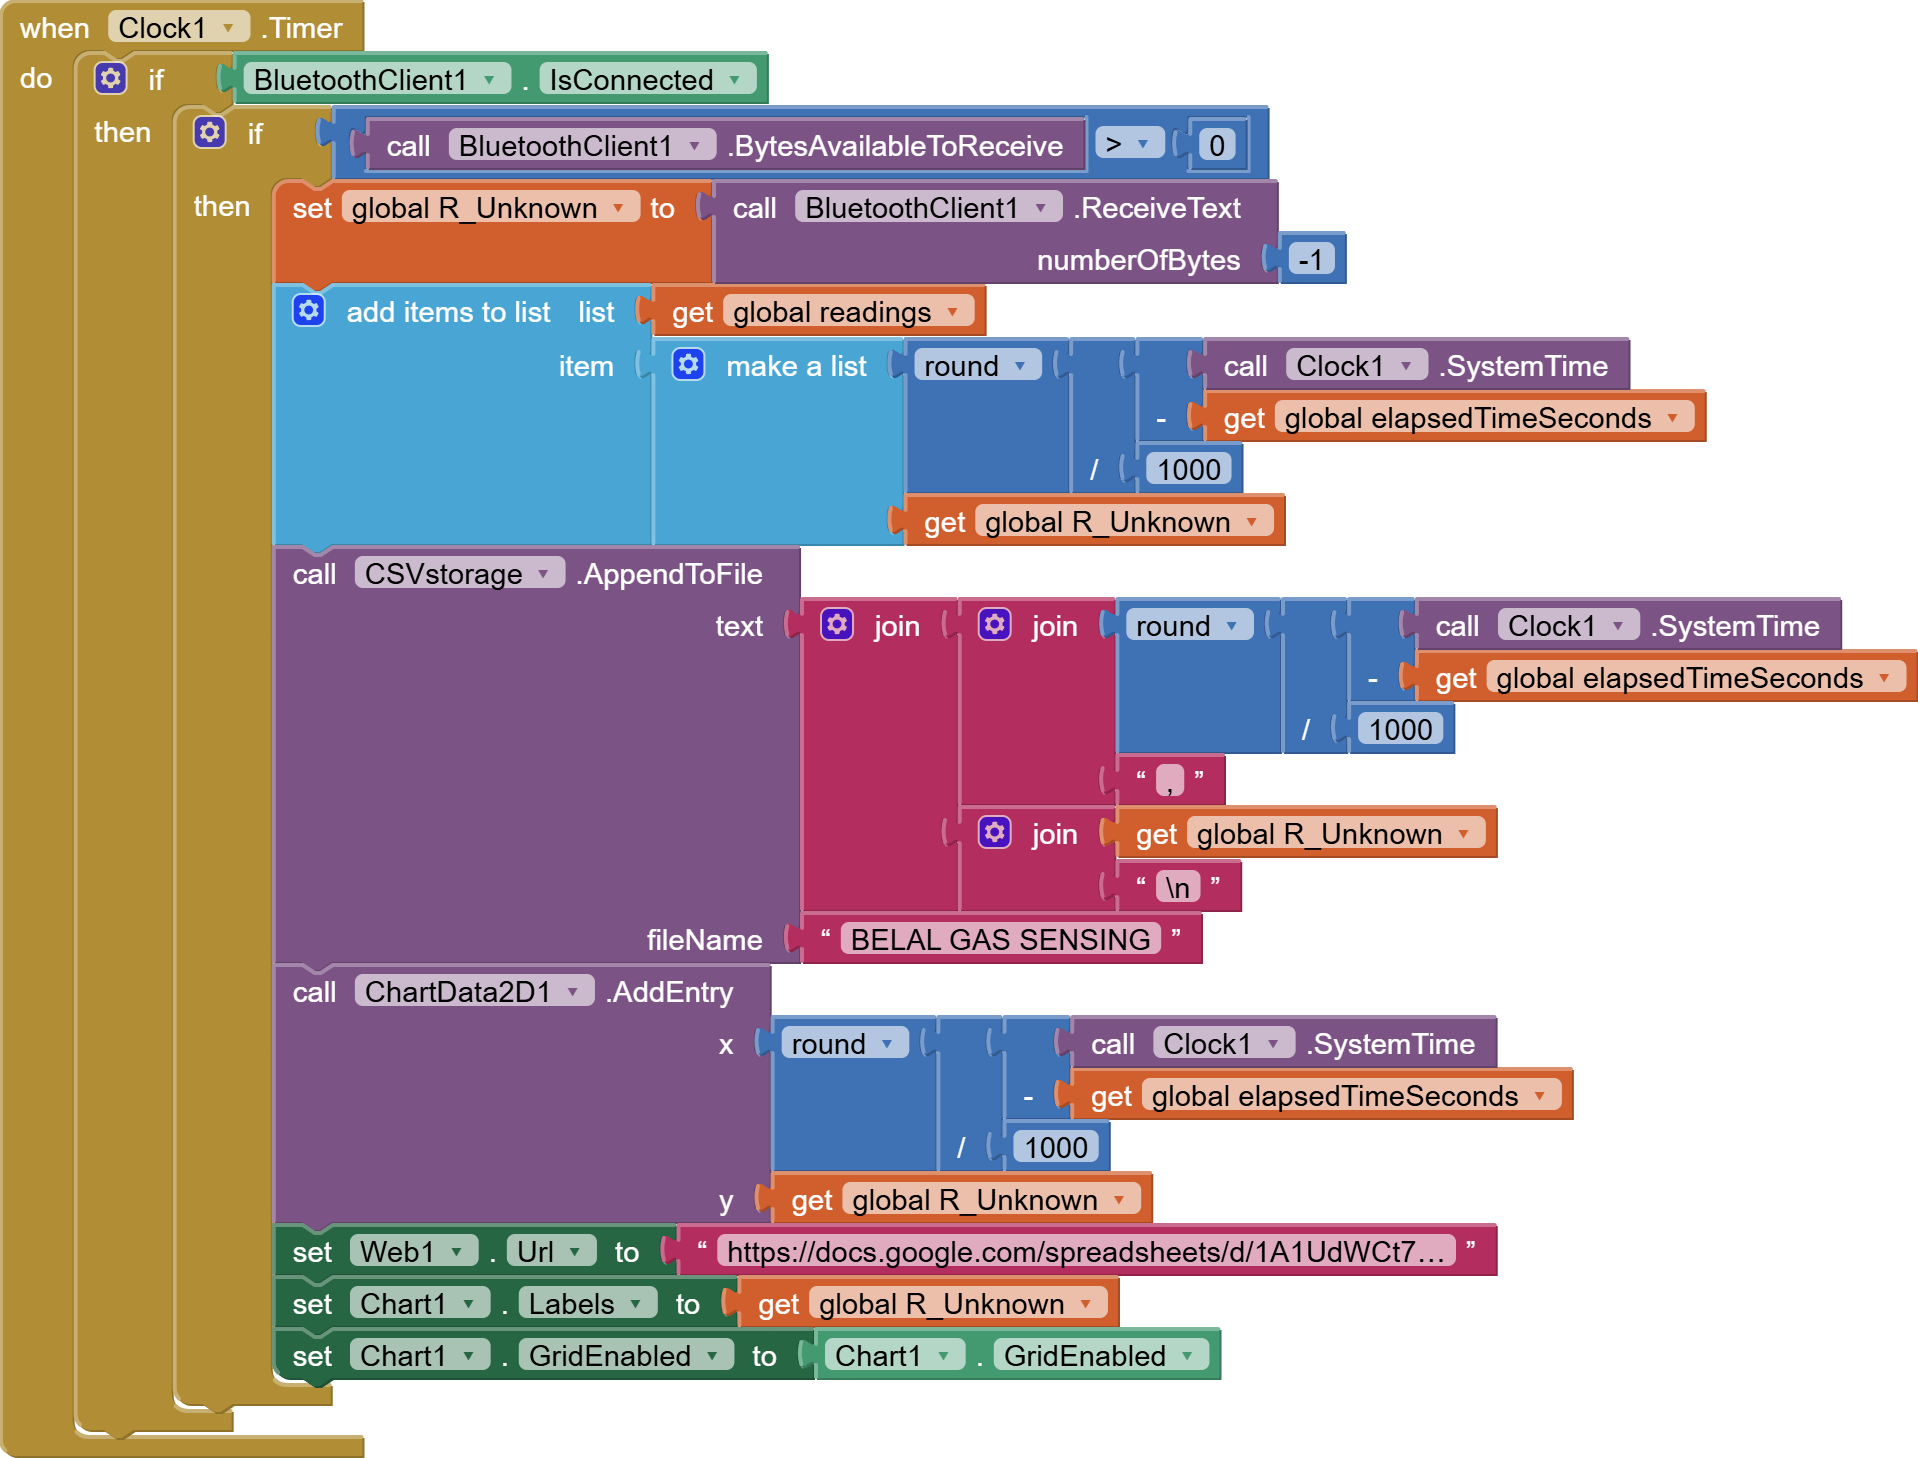
Notice how the global variable name change makes more sense, where SystemTime of start is being subtracted from current SystemTime, giving elapsed milliseconds, then rounded into seconds.
Those seconds are being loaded into item 1 of each (time, R_Unknown) pair in list global readings. That's handy for later, when we need a list of Labels for the Chart.
(I have no idea why you are loading a Web URL. It's not like you are issuing any Web Gets to it. That makes your app look like a product of a cargo cult.)
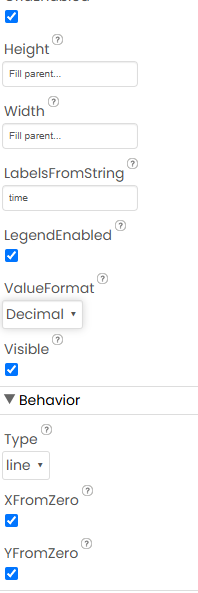
I hovered my cursor over the green Set Chart1.Labels block, to raise its tool tip.
That's how I know it needed a list of x values, and not that R value you had before.
I also set the chart GridEnabled to true, since I am guessing you wanted a grid, from that ineffective block you originally had setting the setting to itself, which would have done absolutely nothing. If you don't want a grid, set it to false.
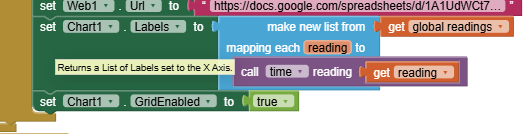
old:
new (after variable rename):
(Same deal with the Web URL mumbo jumbo)
This should clear the error message on setting Labels.
All blocks are draggable.
I suggest you drag in the init global startSystemTime first, since all the other blocks depend on it.