How do you use a Wheatstone Bridge to calculate Resistance using Bluetooth?

I tried your SciBlock linear regression extension in a separate Project, and it crashed on me.
image

I had copied it from
https://github.com/SciBlock/extensions/raw/refs/heads/main/com.SciBlock_LinearRegression10demo.aix


SciBlock_demo.aia (79.3 KB)

I suggest using the AI2 linear regression component.

I also notice in Screen4 you are shoving all your textbox inputs into the extension, without checking to see if they are all number, and not blanks.

I tries a sample call to your .aix in Screen4, using what should have worked, and it also crashed.
image

The AI2 regression component looks like all you need.

I can't go further on this without some training data for the regression model.

Tyoe some (SR,PPM) pairs into a spreadsheet, and download the CSV table here.

1 Like

Here's a rewrite of the Screen4 Calculate operation, taking into account blank inputs:


The calculate procedure only adds valid x and y pairs to the regression inputs xList and yList.

I left out the Prediction calculation, because my high school algebra has faded, and I am not sure which is dependent on what (ppm vs SR).

BELAL2025NANOMADVERSION7_copy_copy (1).aia (333.6 KB)

1 Like

image

Pop up a Notifier with the x and y, or drop them into Labels.

1 Like

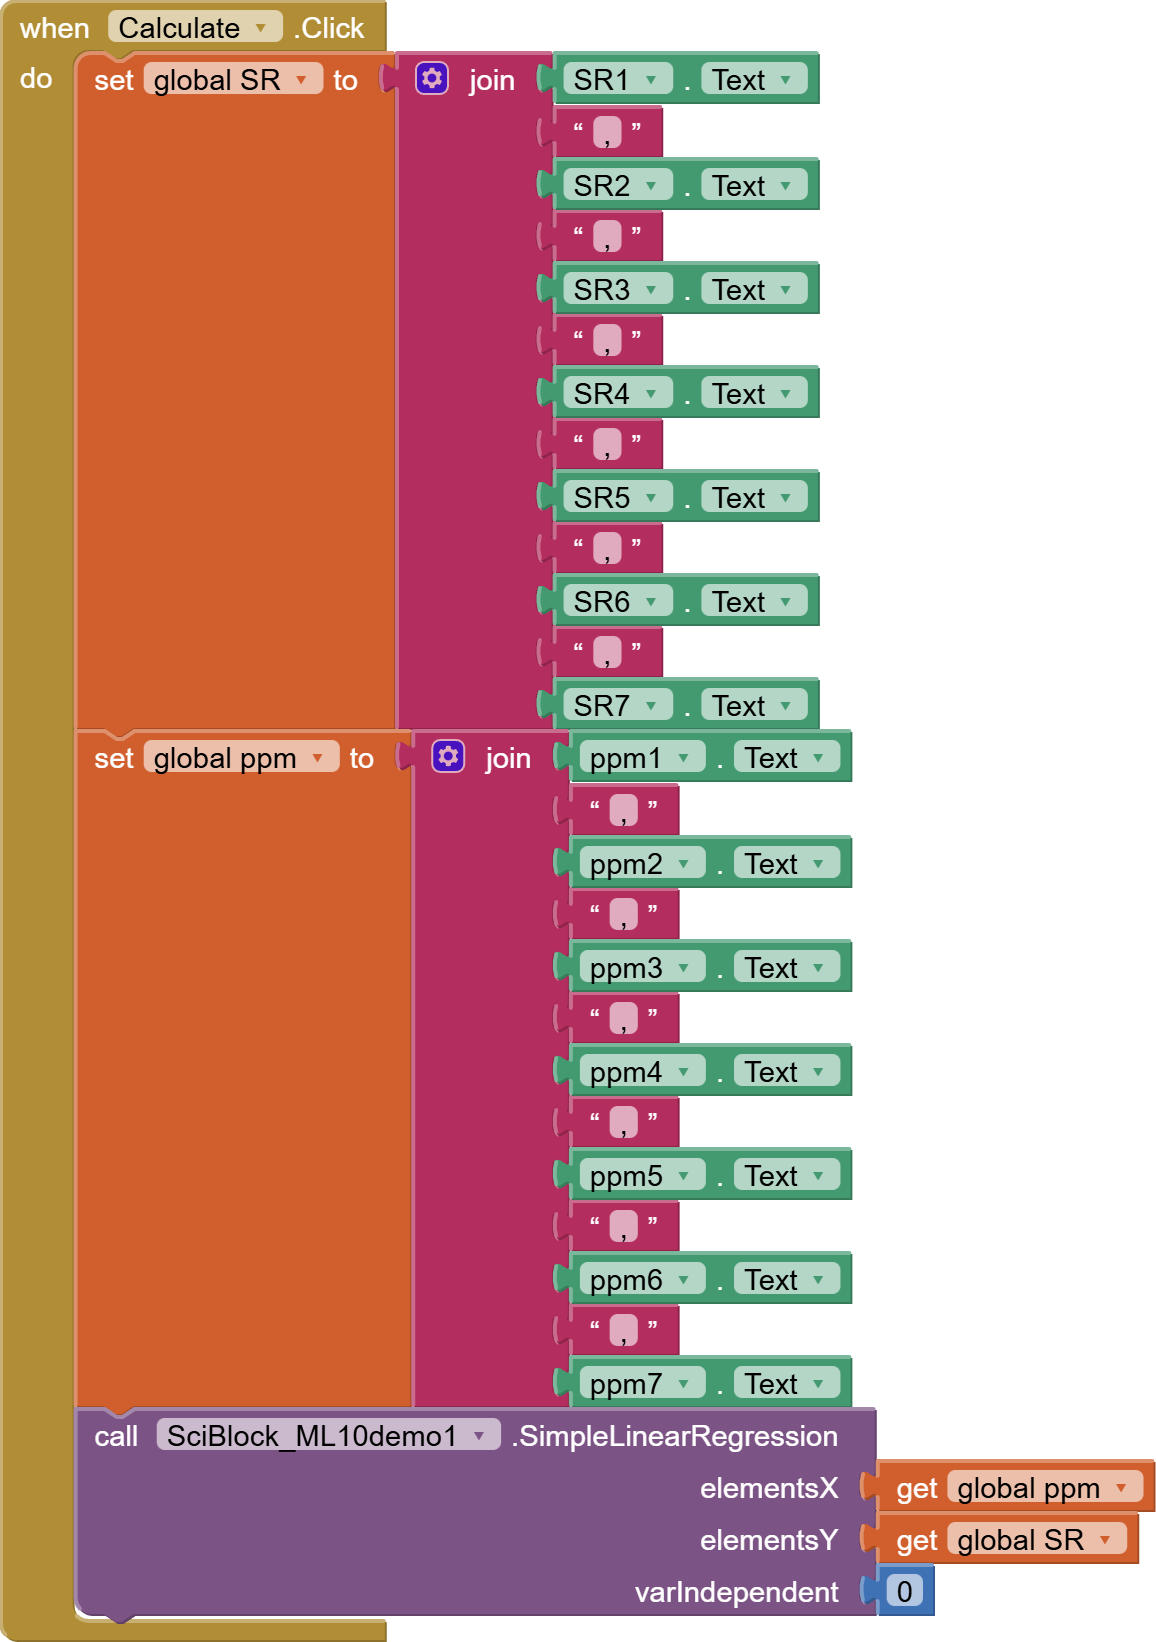
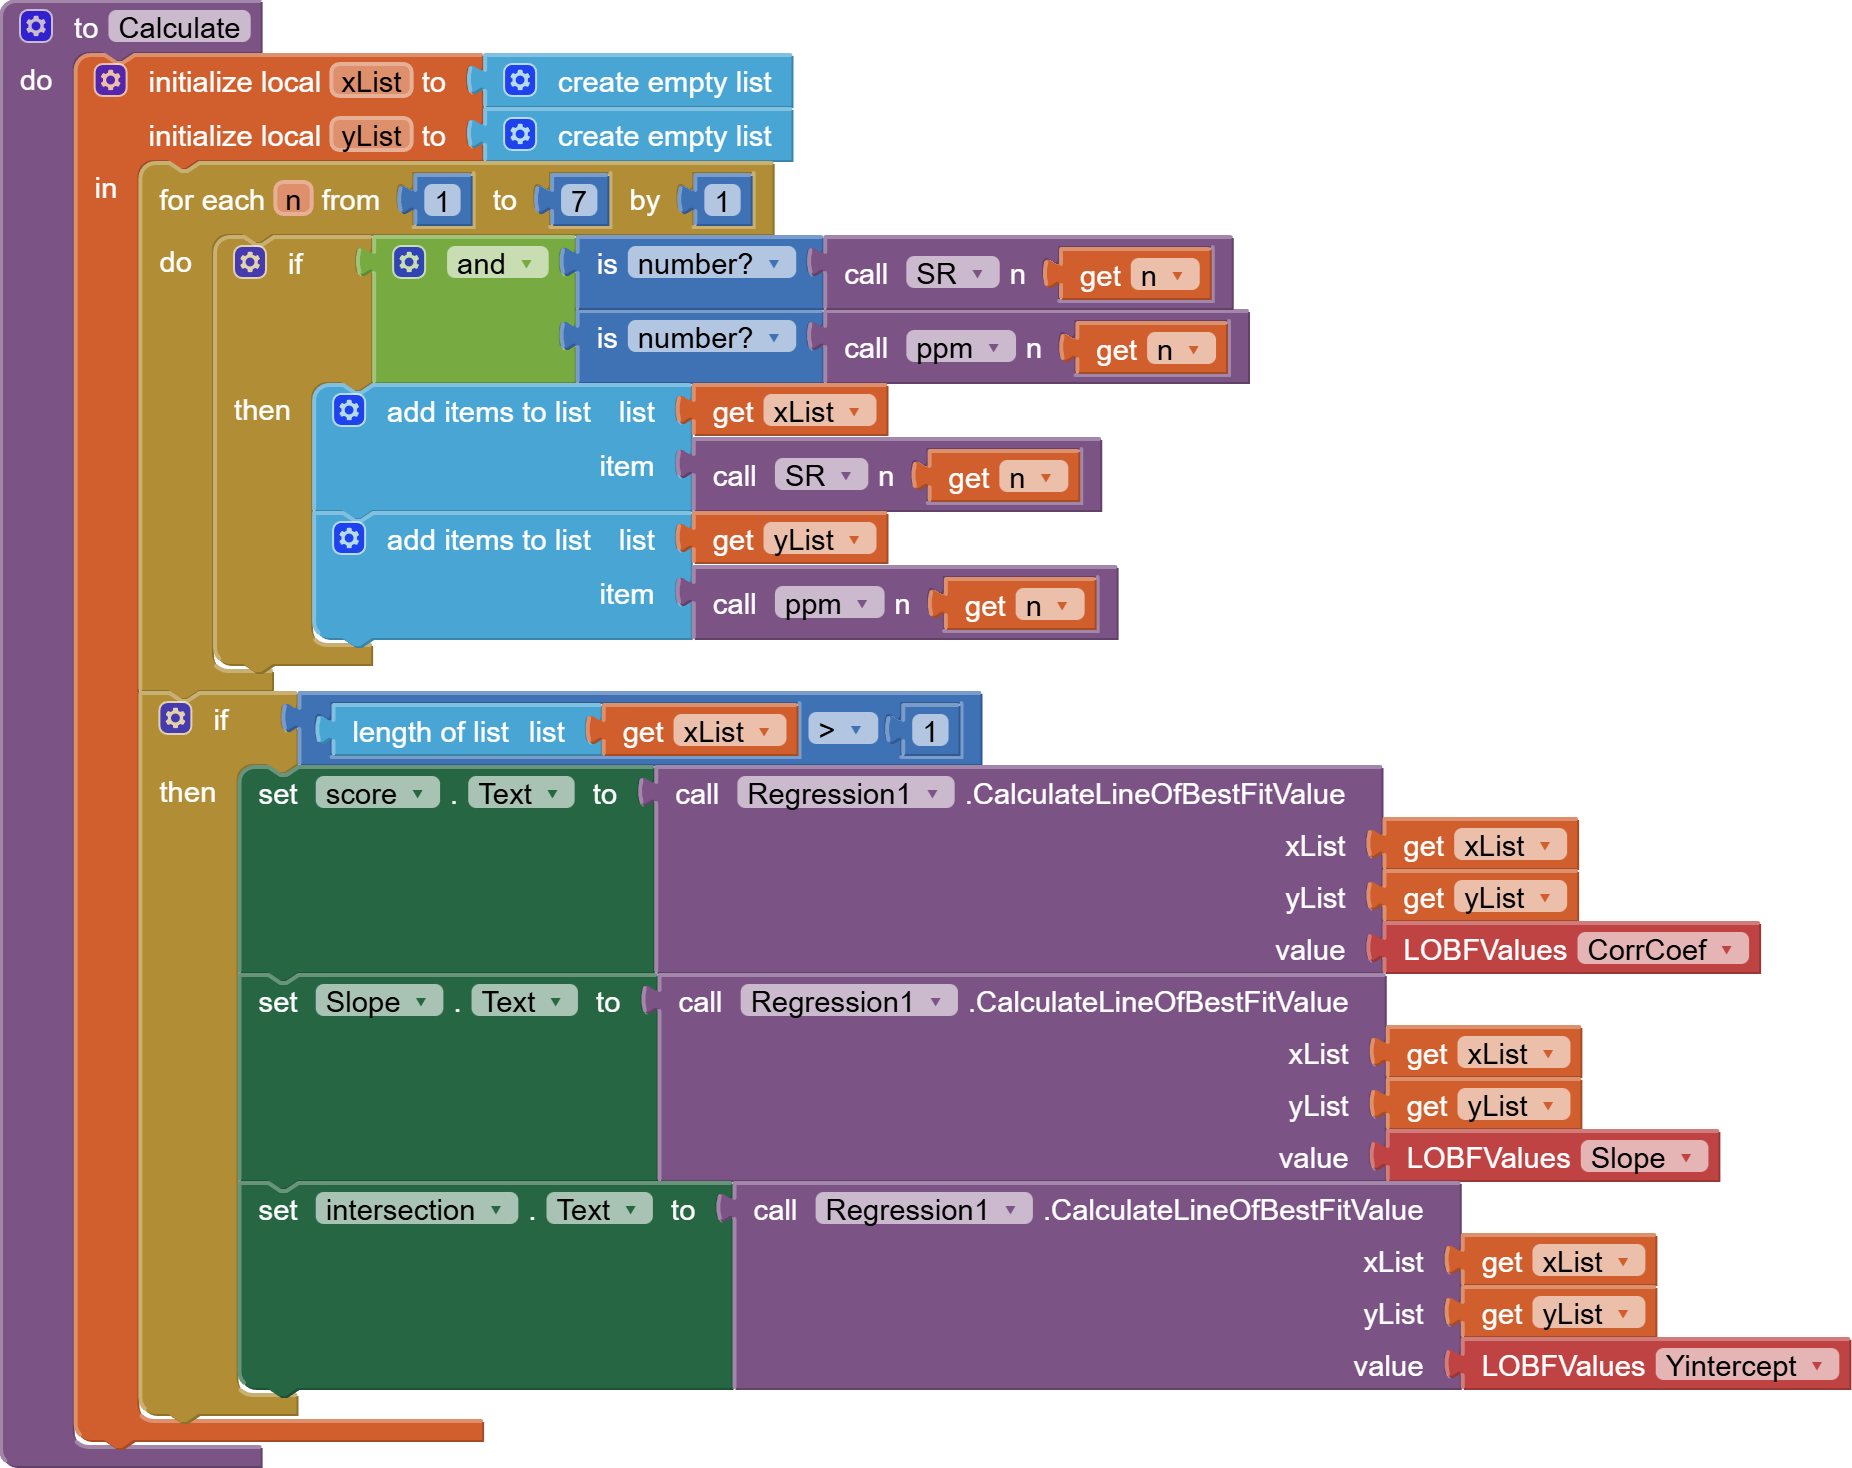
Looking at Screen4 and its regression model, I see you have a chicken and egg problem.

(Which came first, the chicken or the egg? Every chicken came from an egg, but each egg came from a chicken.)

Which came first, the pre-loaded sets of (SR,ppm) pairs used tor calibrations for different materials, or the experimental Bluetooth readings that needed the SR/PPM slopes for their calculations?

1 Like

To get the calibration, I have known concentrations of gases to get their response; then, I can detect unknown gas concentrations.

@ABG Thank you so much; now screen 4 is working.
I will get the calibration from known gases concentration by getting their SR response in a normal situation of R vs t to get R gas and R air in screen 1, then, i will add them in screen 4 to get the concentration of unkown gases.

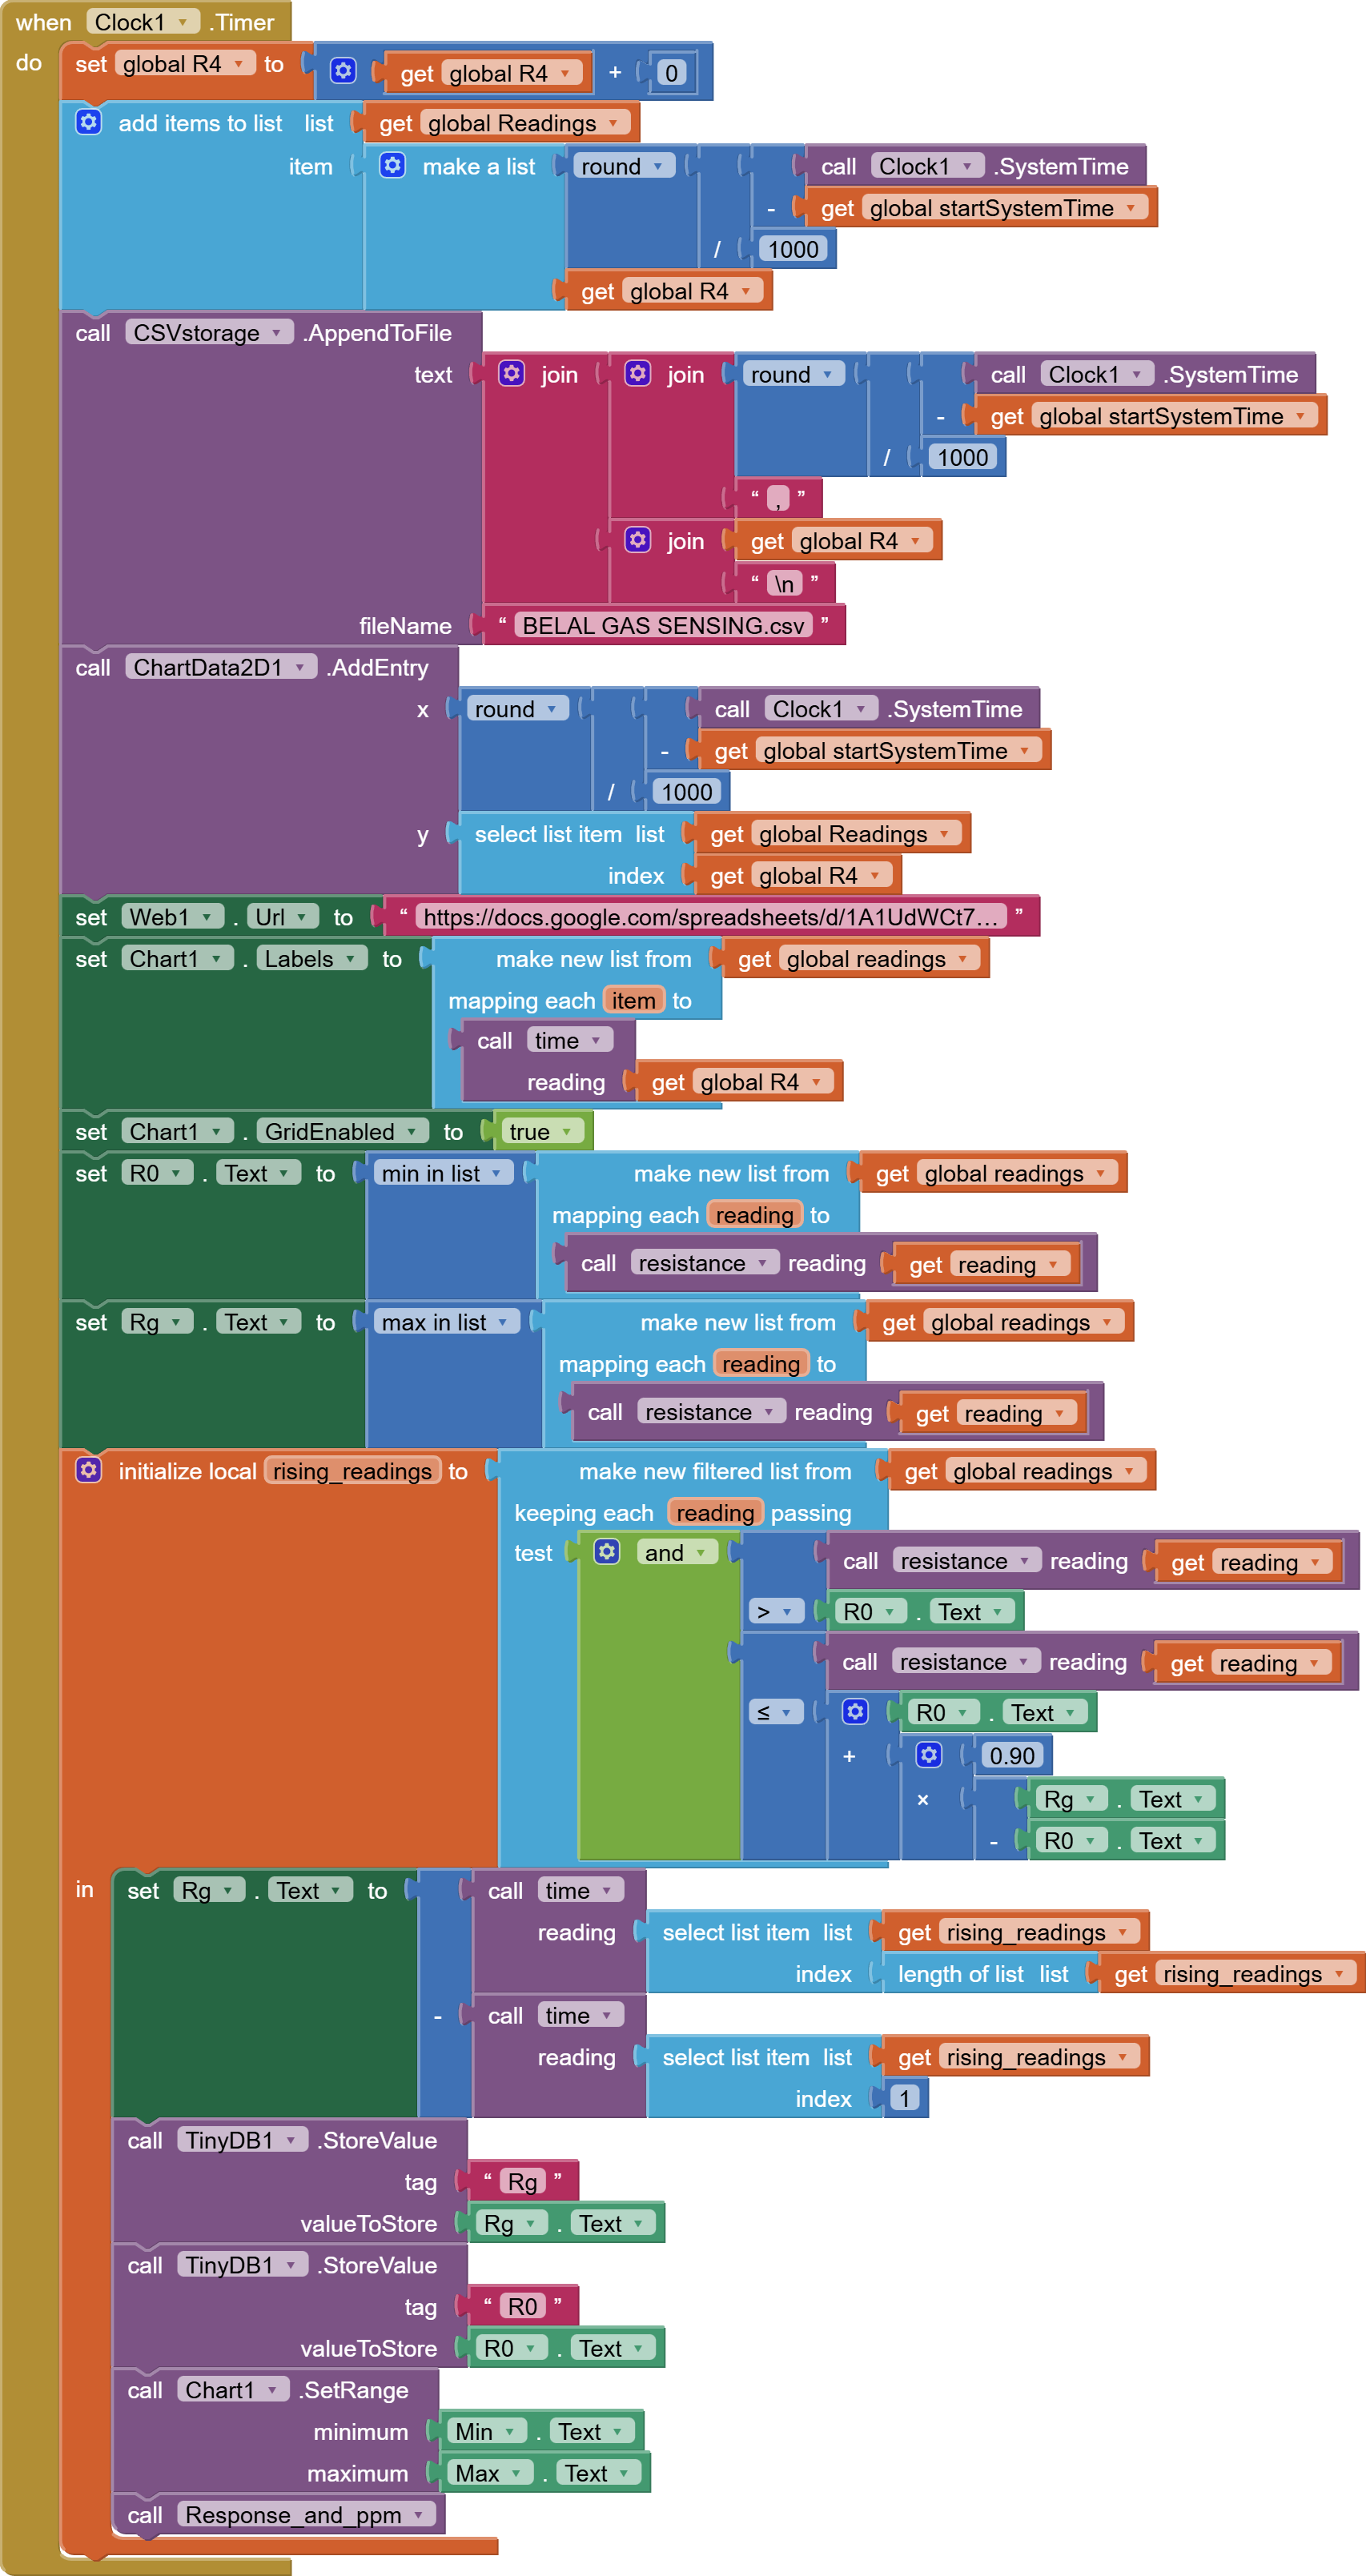
I need the calibration to calculate the ppm of the unknown gases. So first I will receive voltage from ESP32, and the resistance will be mathematically calculated from voltage by the Wheatstone bridge. After that, the resistance will be plotted to get Rg and Rair by the Analyze button, which has to work by clock, not by pressing, and from them I will get the response by dividing Rg/Rair or Rair/Rg, depending on the gas and material type. Also from the calibration screen, I will get the slope, which will be used to calculate the ppm, and also I need to rotate the gauge automatically.

I need to make it pop up on the chart itself, I tried to do but it doesn't give any response.

You will need to rethink how you store calibration data.

It needs to be stored by gas.

While I go back to sleep, study

  • Dictionaries
  • JSON
  • TinyDB Namespaces
  • Three column (SR,ppm,gas) table storage and advanced list filter blocks

There is also the issue of calibration data provenance.

Will this calibration data be provided with mass produced gas sensors, or is this just a lab prototype proof of concept?

1 Like

Hello @ABG
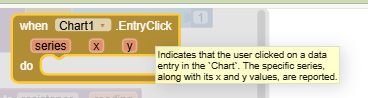
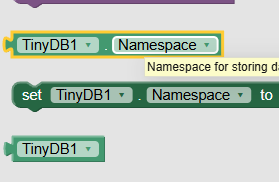
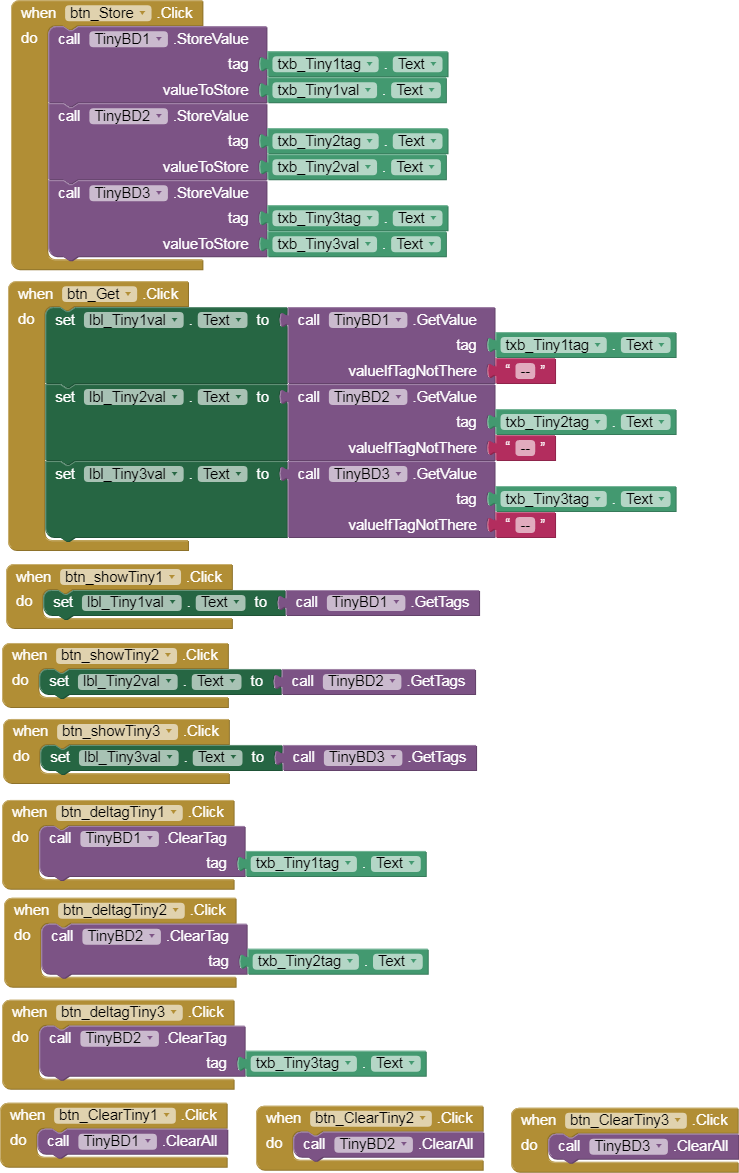
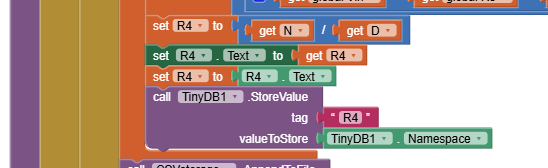
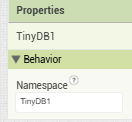
Please I have tried to use a dictionary to save the data and recall R4 again on screen 1 from screen 3, which is the y-axis in the chart, but it does not work. Furthermore, I used tinyDB4 instead of DB1. I used the entry click to get x and y axes, but they are in text boxes, and I need them on the graph itself.
For your question, this app is for a resistive gas sensor for one gas only for this time; next time I will plan to make it for different gases.

BELALGASSENSOR.aia (333.6 KB)

Did you change the TinyDB Namespaces for TinyDB4?

What did you use?

1 Like

Sorry, in the first I did not get it, I will change it now, I am so sorry

image
Prefinalappgassensing (2).aia (333.9 KB)
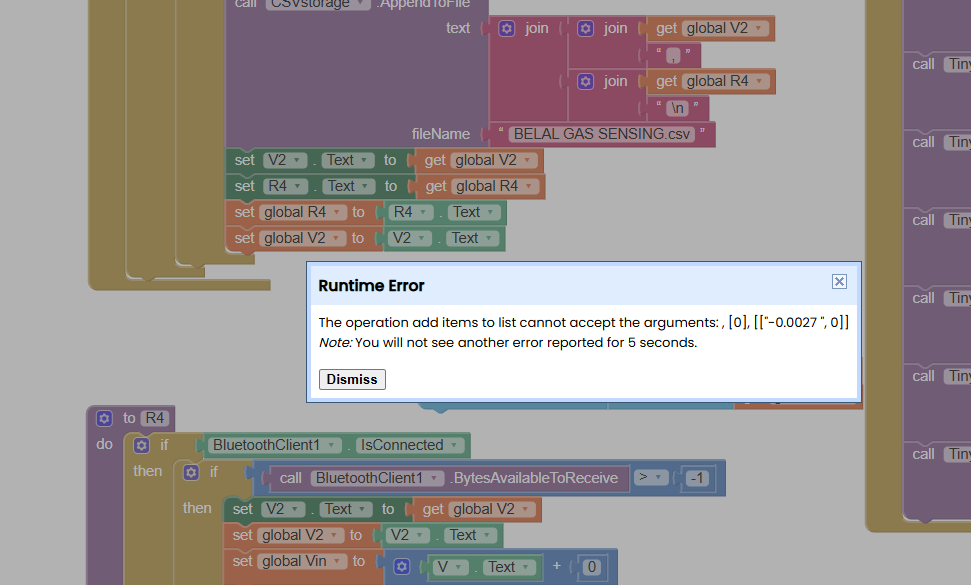
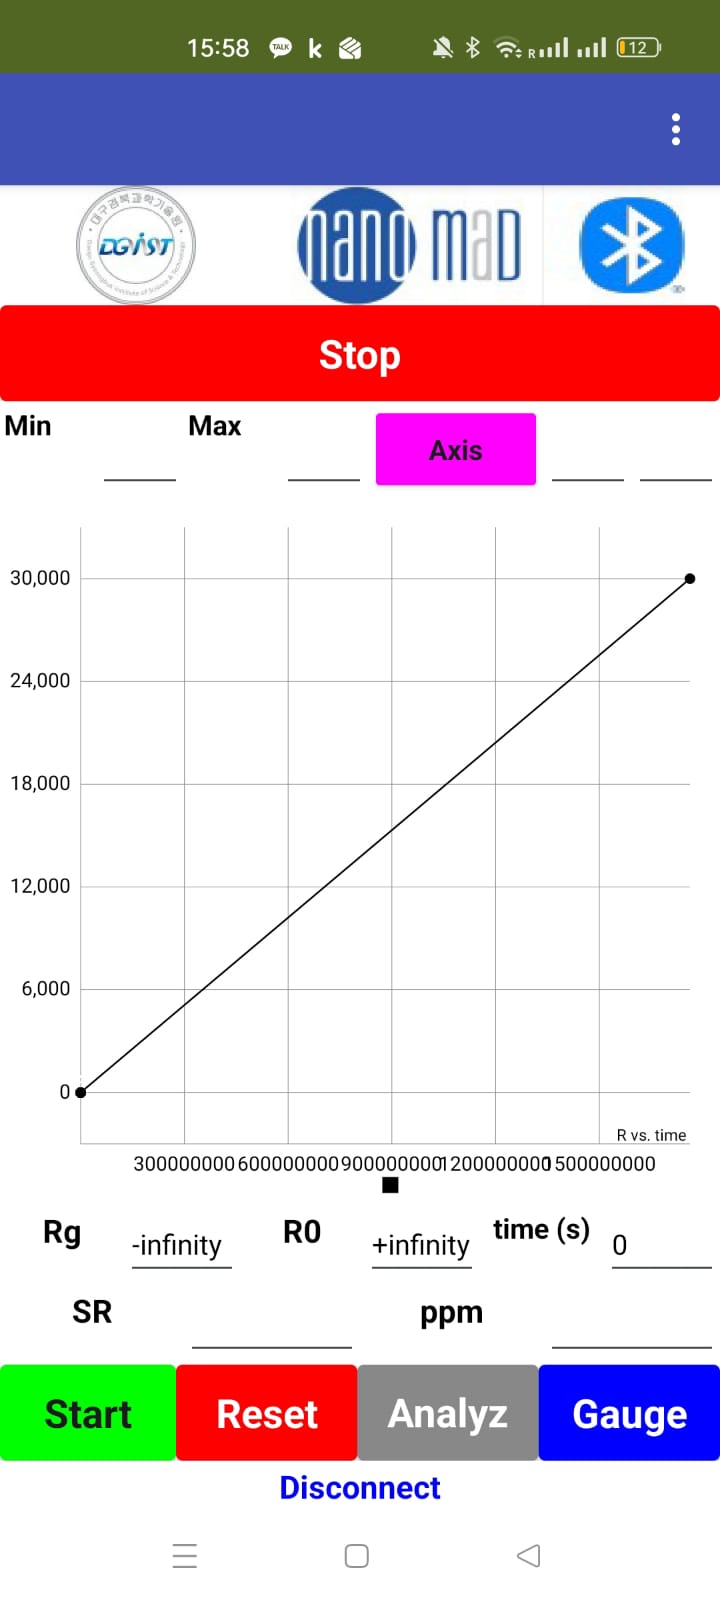
As you see, it can calculate the resistance R4, but it is not showing on the chart, and also V2 is showing in text box V2. Also, the gauge is working, so thank you so much for being kind to teach me and answer my questions.

I'm confused because of this.

I have to use something like this example; I will try.
Could you please explain how I can use in my project to store Voltage and R4, and call R4 in char2D?


https://groups.google.com/g/mitappinventortest/c/dYFiE6xrEKc

You need to put more thoughts into how you aggregate and store data.

Collections of readings should be identified by either gas name or by sample identification.

Eventually, I imagine you would be matching sample reading collections against known gas data, for the purposes of identifying samples

1 Like


Actually, it is difficult to show the resistance calculated from voltage on screen 3 on the chart on screen 1, I am trying, but I did not get the solution.
Now I can get the voltage and resistance on screen 3, but still no response on the screen 1 chart.


BELALFINALPROJECT.aia (337.1 KB)

AI2 Screens are separate programs that share no global variables and no components.

The only thing available to them across Screens are instances of TinyDB, according to their NameSpaces.

If you switch Screens, you have to reload all your global variables and GUI components from TinyDB or Files.

There are two events that capture coming into a Screen:

  • Screen.Initialize, and
  • When Other Screen Closed.

To cover both possibilities, you could do your reloading in a common procedure called from both events.

1 Like

image

Why are you setting the WebViewer gauge pointer based on a missing Slider component's thumb position?

Do you not see the red X?

1 Like

In Screen3, you are treating global variable Readings as a list when you add a pair to it.

image

But look how you initialize global Readings in Screen3:

image

The number 0 is not a list.

You can't add items to the number 0.

To start an empty list, use the Create Empty List block.

1 Like

In that same Screen, you calculate a local value R4
image

but then you store the text NameSpace value TinyDB1 into TiinyDB1 under tag R4.

image

I also see you loading values from tags R1,R2, R3 in other Screens, but not R4.

Did R4 offend you in some way?

1 Like

Thanks, I am trying to find how I can do it, as I still need two things, and I will finish my project. First is plotting R versus time and ppm to rotate the gauge.
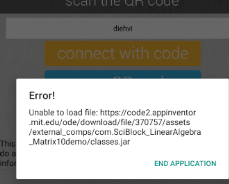
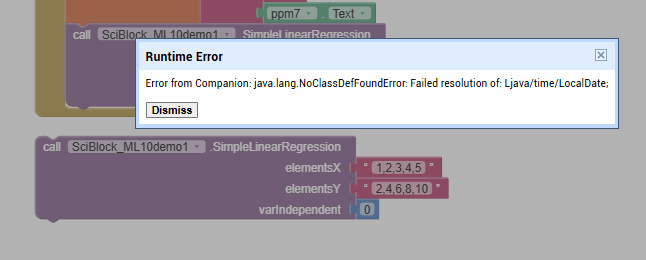
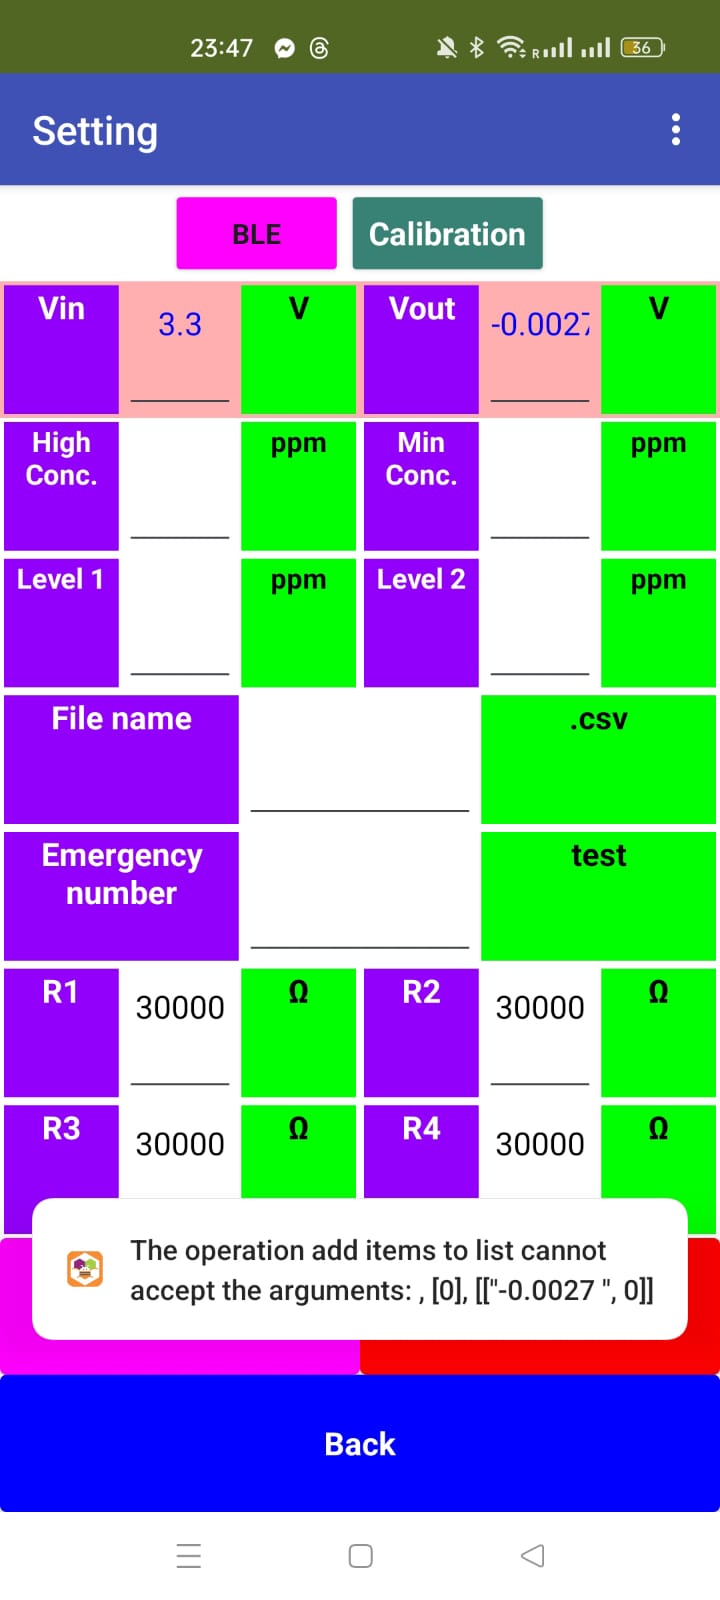
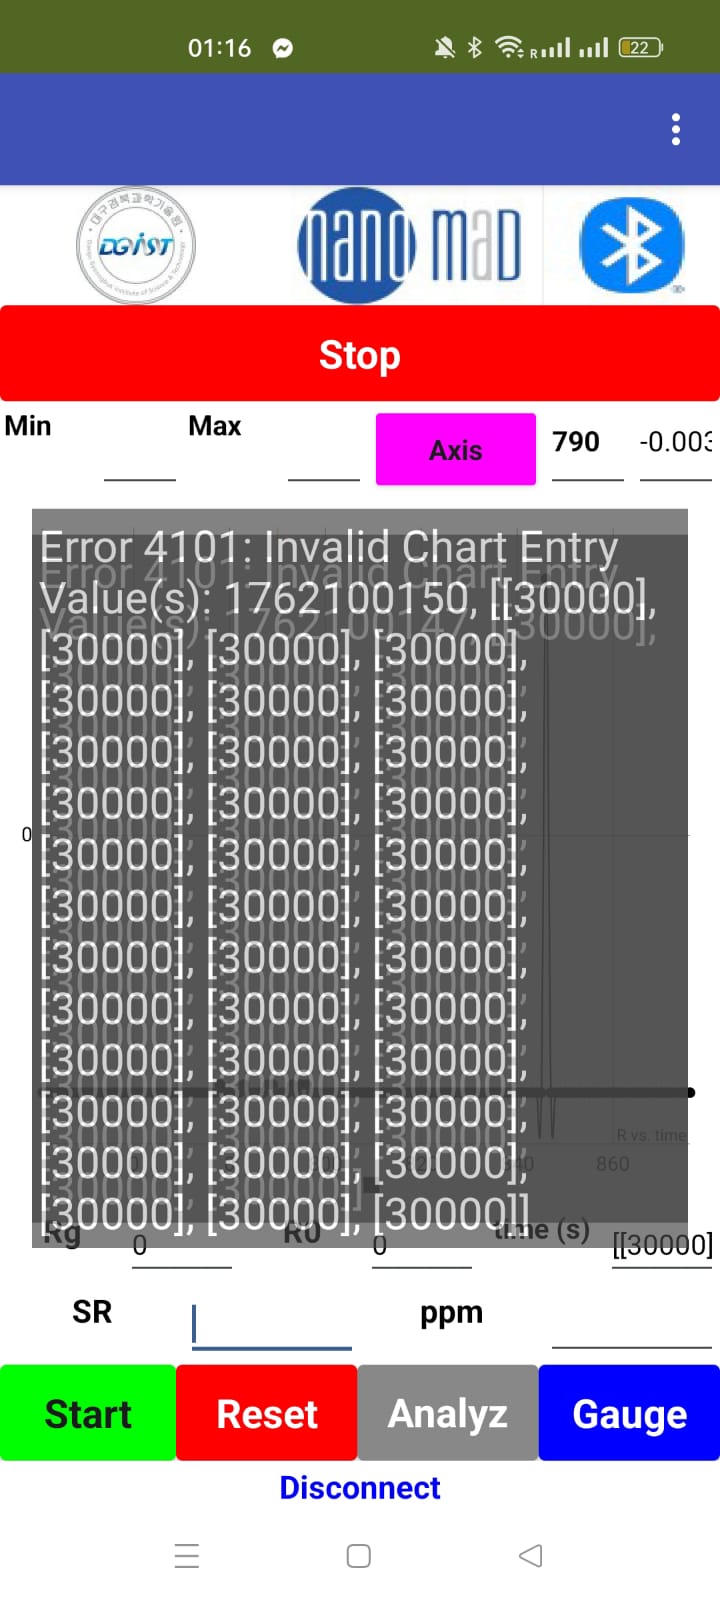
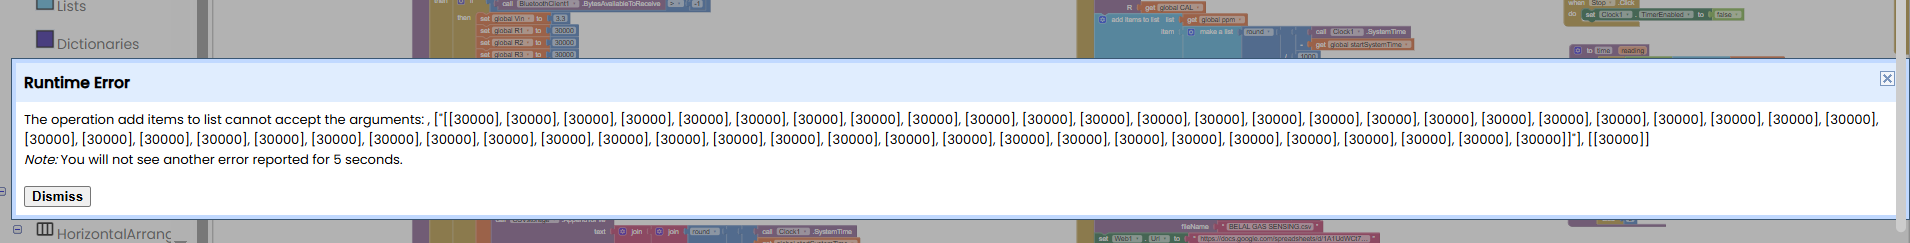
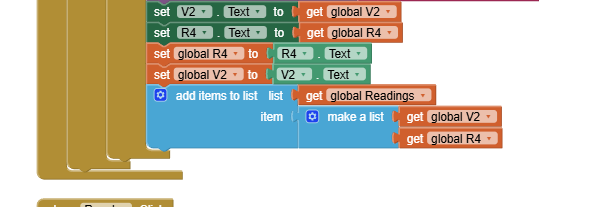
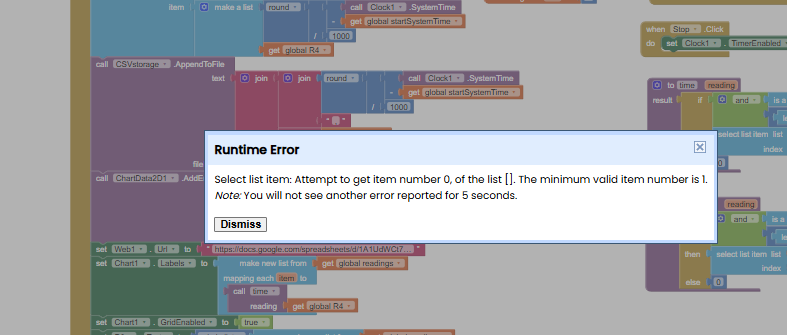
Still, it is giving error


BELALFINALPROJECT3.aia (336.2 KB)

From the following photo, I can tell, it is now calling the screen 3 data.


BELALFINALPROJECT3 (1).aia (336.4 KB)
Please I am almost near to doing it; please help me to know the solution for the error.


Here, it is reading the voltage, but on the PC screen for MIT APP WEBSITE, it is reading the R4

You can't select items from an empty list.

Item numbers start at 1, not 0.

You need to test the number of items in the list before trying to select items.

If there are no items, don't do anything with it.

Use length of list block for the comparison against zero.

1 Like