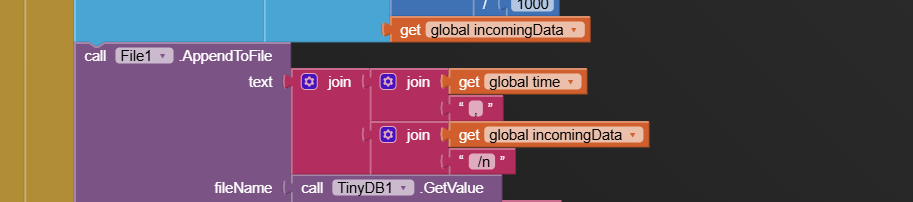
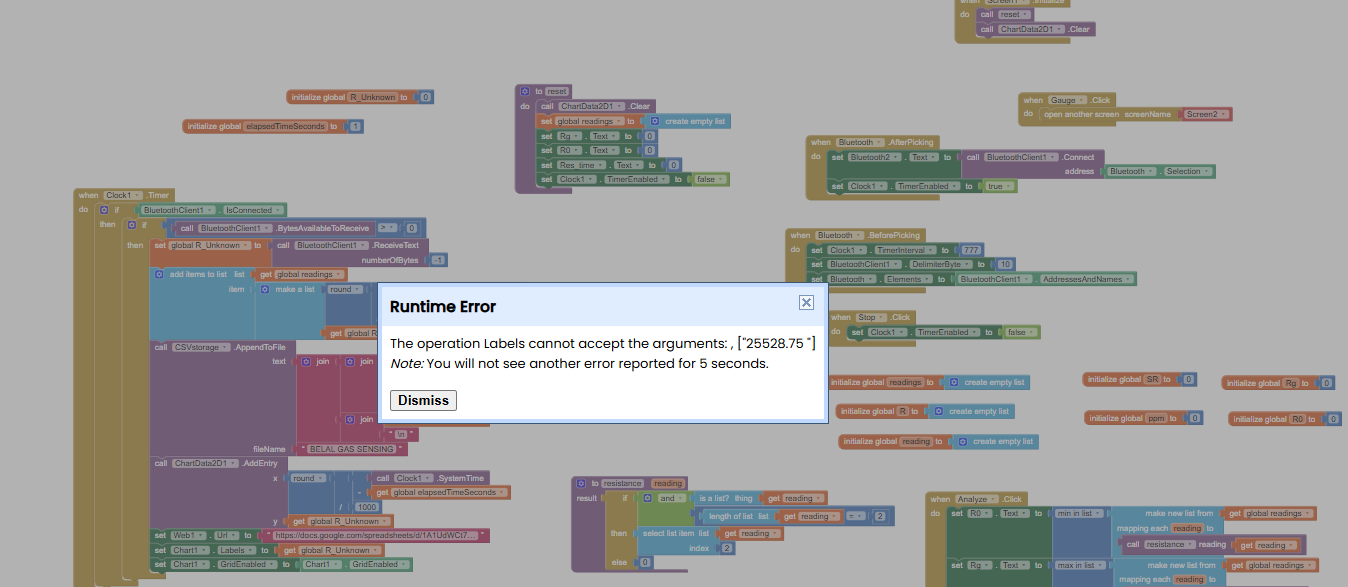
Looking at the block image you posted, you used /n where you should have used \n.
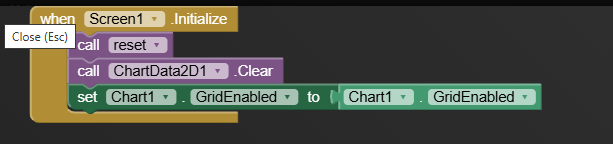
What is the point of setting a setting to its current value?
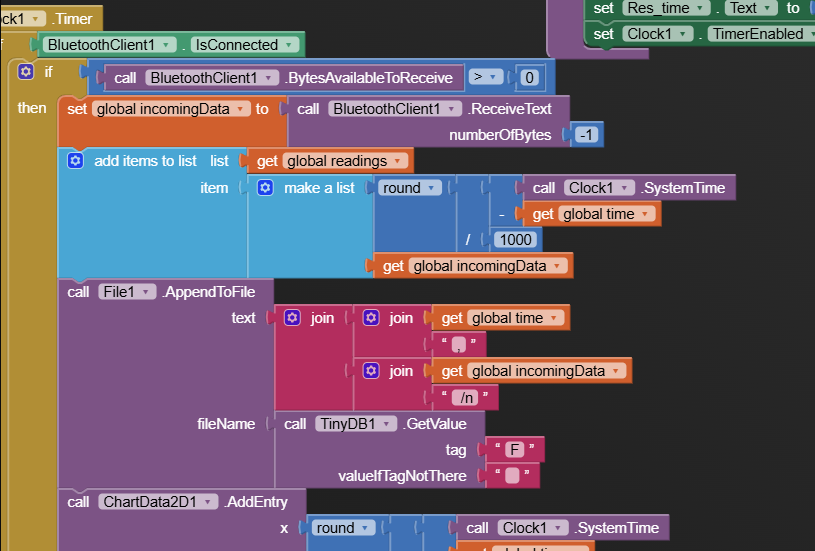
I can't see from your blocks what file name you are writing to in the Clock Timer.
That might be a problem at run time.
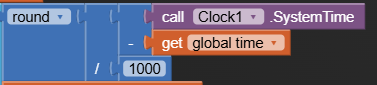
Also, you are writing the start time in column 1 of your CSV table output, instead of the relative time in seconds from the start of the run, which you are adding to the local table properly.
Why did you not copy the already working expression ?
That's from 2019.
Stuff goes bad over time.
You don't need a fancy gauge.
Just Draw fat colored bars on a Canvas, proportional to your range percentages.
Or change the background color of a Label.
1 Like
For a PhD candidate, this is poor quality code.
Using a name like 'time' for a variable is just plain shoddy.
It caused you to trip over your own nomenclature failure, when you were writing to a File.
I expect to see variable names fleshed out with more context in future code submissions, like StartTimeinMillisecondsfrom1970.
Ai2 has full capabilities for renaming variables and keeping references to those variables in sync.
Use them.
This might help
You also can search the community to find more ideas...
Taifun
The Companion is a separate app from whatever app you build.
Some versions of Android prevent one app from overwriting a file written by another app.
Try a different file name.
Other sources of crashes on a newly built app may include:
- Poorly chosen TinyDb default values kicking in
- Lack of Permissions for BlueTooth
1 Like
I changed it, but the timing is starting hours: minutes: seconds, but I need it as seconds only on x axis.
Yes, instead of gauge I will use bar made by canvas as it will be much easier. Thanks ![]()
So please how I can do like this or even circle with increasing the colours and changing the colours with increasing the concentration by ppm
I can't support JavaScript solutions, though I might collect links to them on this board.
Thanks, I meant how I can make normal bar or circle using canvas to make three layers of notification or alert.
Study the Canvas component.
You could always just use three labels (no text) with background colours and set the height/width to match your values
2 Likes
Here is a working multicolor bar graph of the current load on the MIT Build Servers
Note how the bar colors change from green to yellow to red as the load increases.
1 Like
Thanks. The problem is with the header ((arrow)) going to the left side. please, send me the aia file.
This is very nice.
Thank you so much.
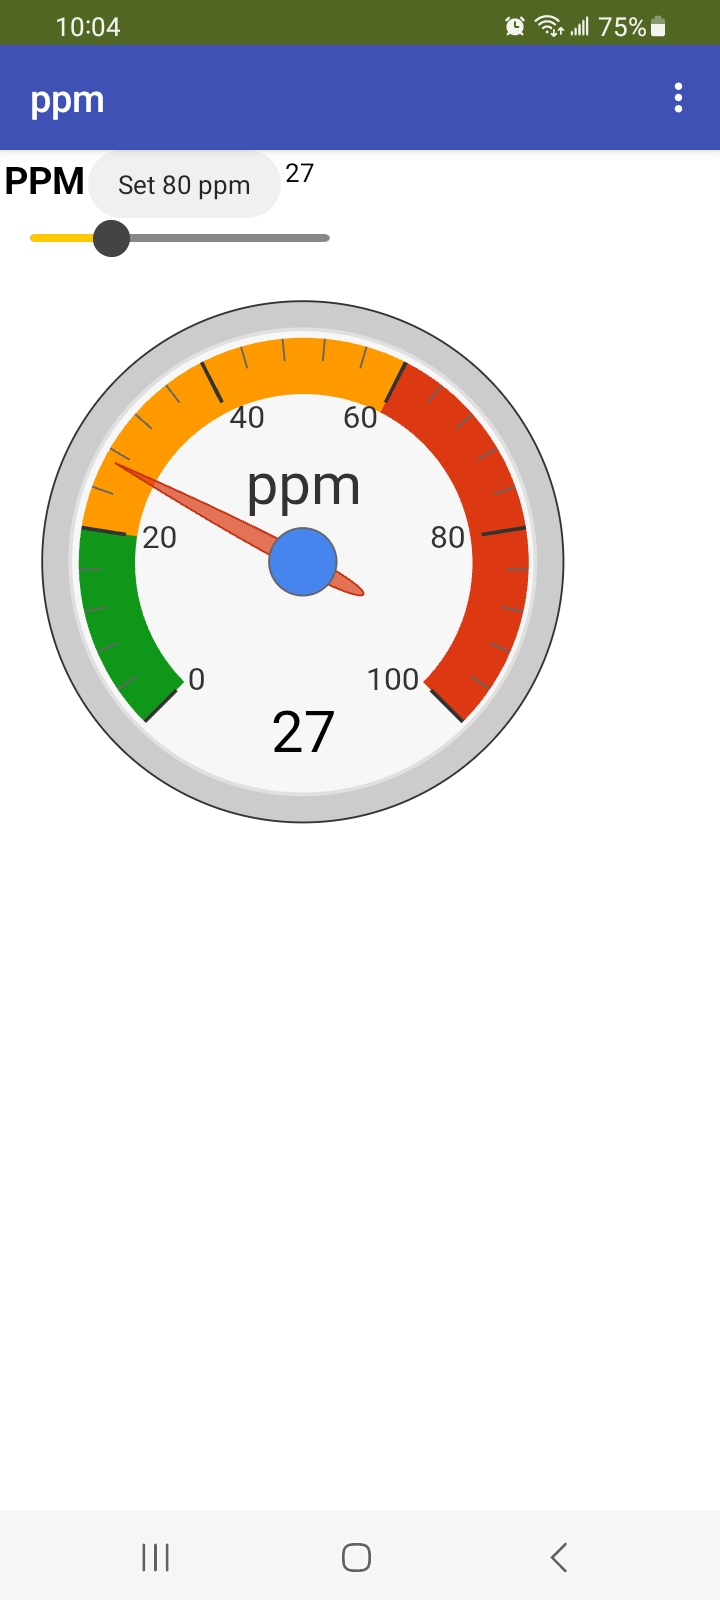
Please, if possible, send me the aia file, as I changed the color ranges and water gauge to ppm, but the header (needle) is not working. Furthermore, I need to change the width and height to fit the app screen. ((Thanks I did it, now it is working))
Also, if you please, help me with the x-axis of the chart, as I need it to read only in seconds, not in milliseconds time since 1970.
(Remaining the x-axis in seconds.
Maybe I can send elapsedTimeSeconds on x axis and R_Unknown on y axis, but how I can do it.
Also, if you please, help me with the x-axis of the chart, as I need it to read only in seconds, not in milliseconds time since 1970.
(Remaining the x-axis in seconds.
Maybe I can send elapsedTimeSeconds on the x-axis and R_Unknown on the y-axis, but how can I do it? Please, I have tried many times to make the x-axis as time in seconds.
For the gauge, I need to connect it to ppm math to work automatically in the app.
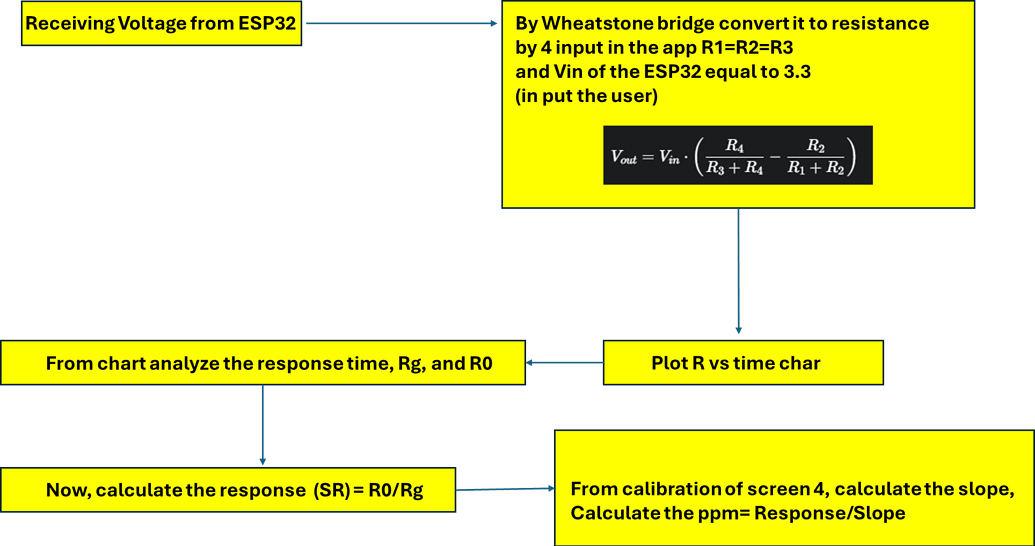
Also, in the last version of the app, I will take the R y-axis from the math calculation of the Wheatstone bridge, so how can I do it?
BELAL2025NANOMADVERSION7 (1).aia (1.1 MB)
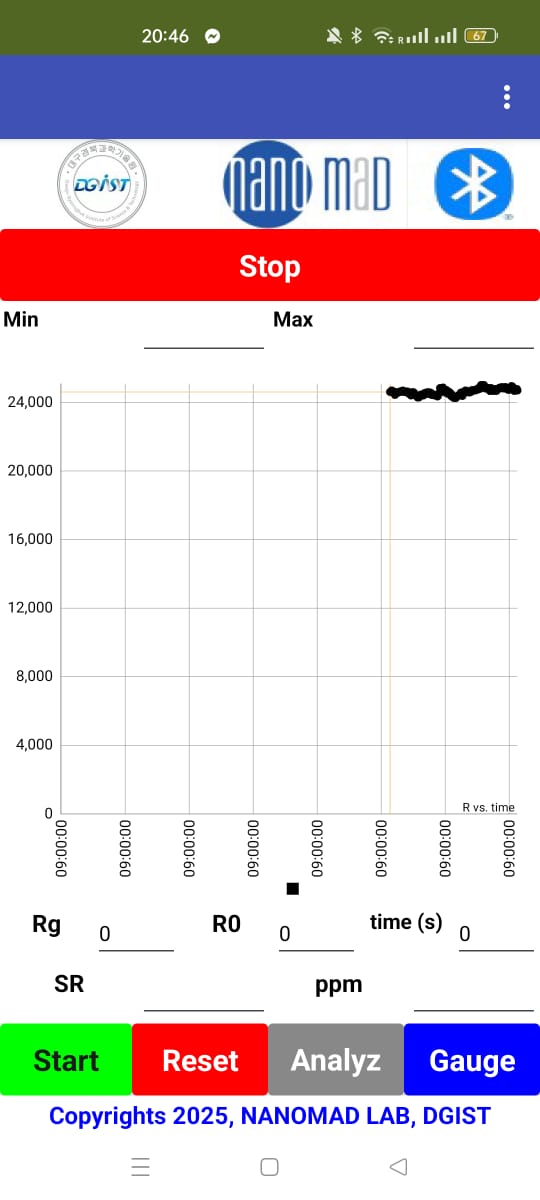
Thanks @ABG Also, now it can analyze the R air and R gas
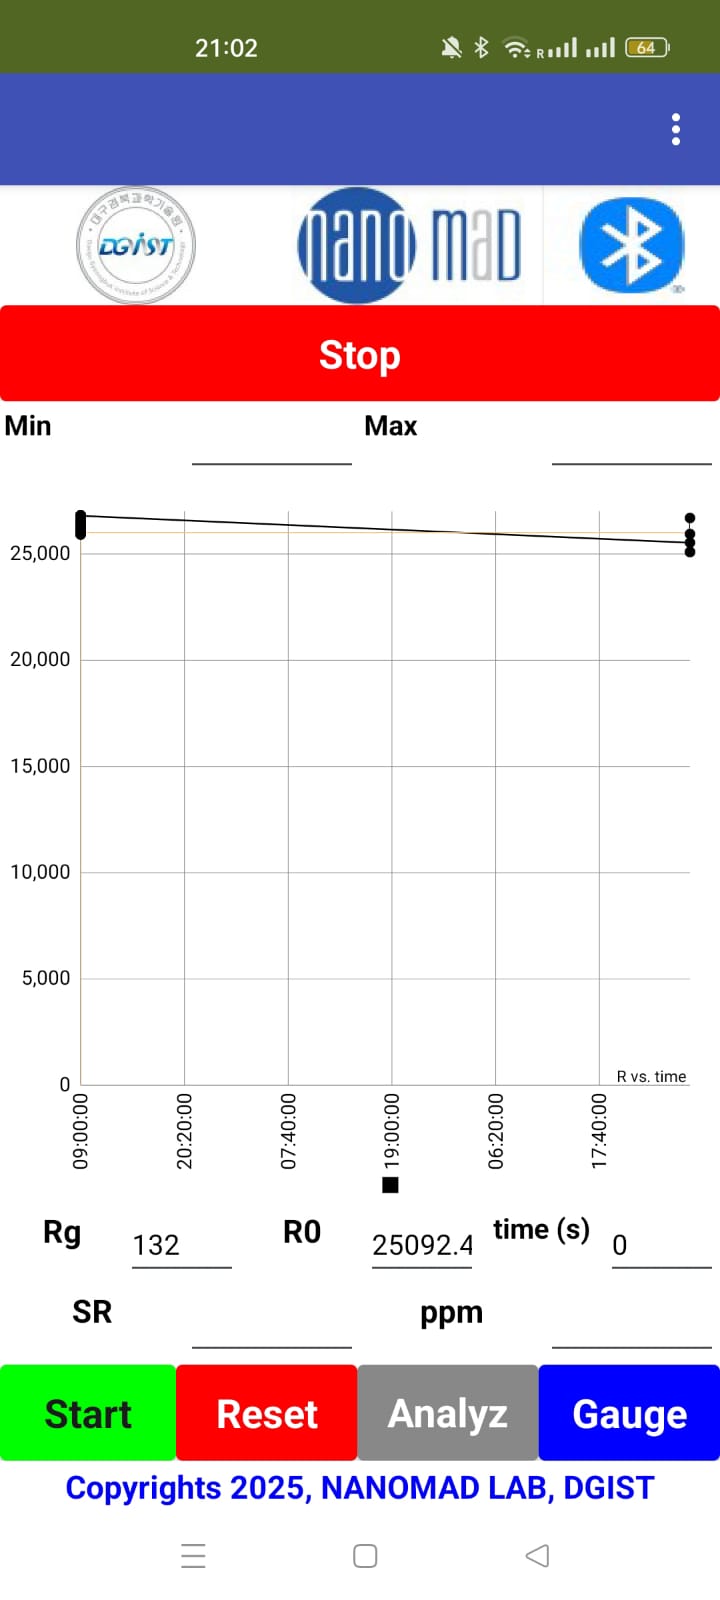
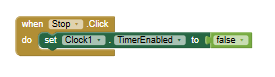
when I press stop, the timer is still counting
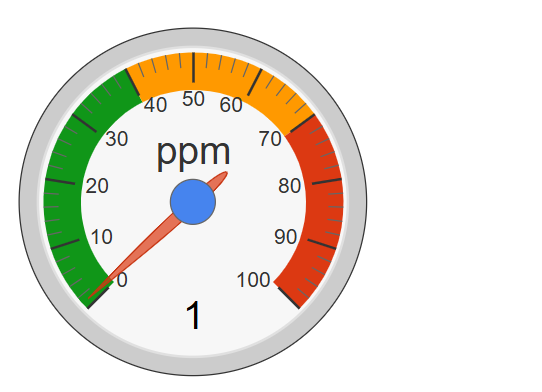
ppmGauge.aia (46.7 KB)
Good luck. This should work when connected to your app's ppm data stream.
Modify the GCppm2.html that is stored in media to get the centering of the gauge as you like it. ![]()
1 Like