hello, i have a question.
is it possible with mit inventor to fill any shape with a color?
is inventor powerful enough?
Thanks for reading.
1 Like
If you are using a Canvas, the answer is yes.
You might wish to read the documentation * Canvas
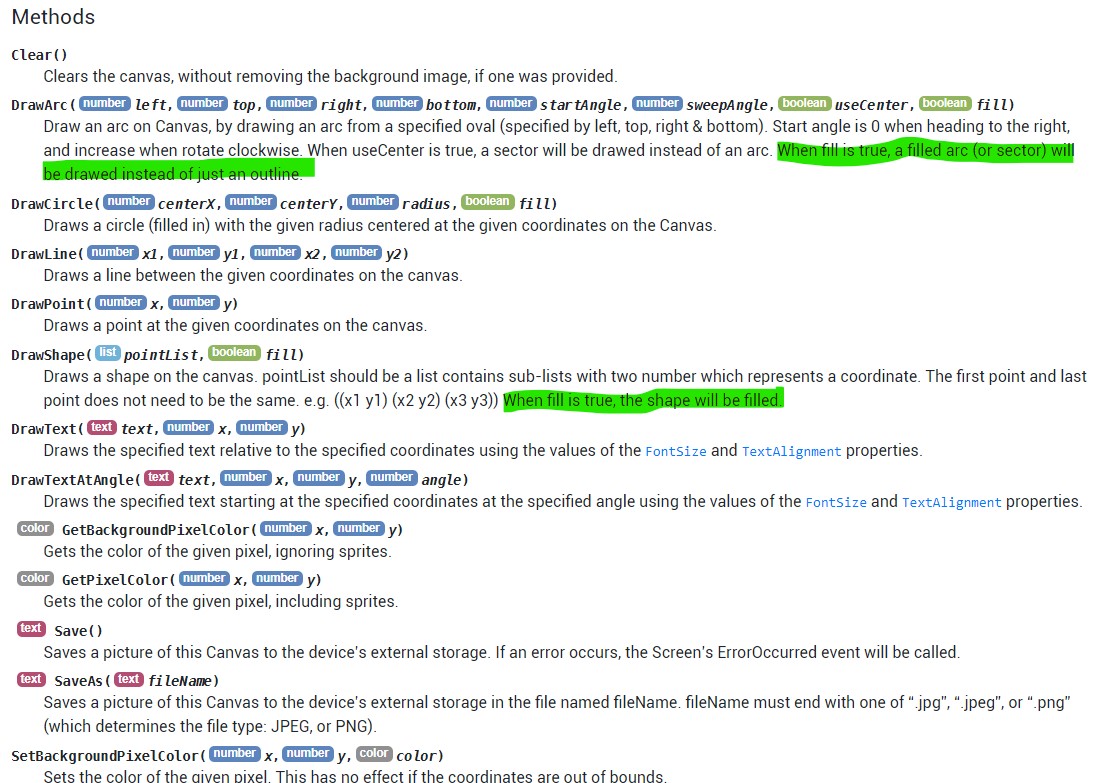
The fill color will be the PaintColor
Specifies the paint color as an alpha-red-green-blue integer, i.e., 0xAARRGGBB . An alpha of 00 indicates fully transparent and FF means opaque.
Also search this board for 'flood fill'.
Again see here ?
thanks for your suggestions, i used drawshape. i need to refine, but it works.
now I have a color. Do you know how I can modify it to make it a gradient towards the transparent?
how does drawshape do for coloring?
thank you
as previously indicated.
yes absolutely, I'm already using this.
what i want to know,
1 ° if it is possible to make a gradient from one color (eg red) to transparent?
2 ° adjust the level where the color becomes begins to become transparent?
Thanks for your help
Try Italo's method http://ai2.appinventor.mit.edu/?galleryId=4720377609060352
Will it work with DrawShape? The method probably won't. The DrawShape fill color is determined by PaintColor. Italo's method appears to be a floodfill. If you need a gradient, you cannot use DrawShape and set the fill to true.
To do something similar with DrawShape set PaintColor
like this 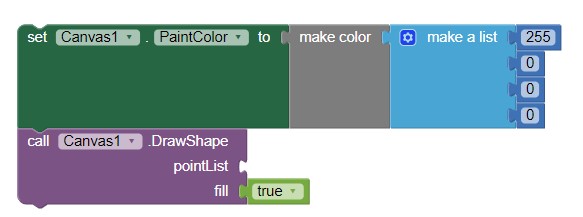 to change the fill. This will NOT fill the shape with a gradient, it will only allow you to continuously modify the 'color' fill of the shape to various transparencies and colors but will not display as a gradient of colors.
You might be able to use Italo's method with the DrawShape and set the fill to false. Does that work? I have not idea. Experiment and please let us know.
You should be able to ' adjust the level where the color becomes begins to become transparent' in a DrawShape by using the 4th make a list item. Try it.
hello, I studied the proposals, I modified them, but it does not give the expected result.
I manage to make myself gradient towards transparent over my entire surface of my canvas, but not just in the curve.
I tried with the canvas color point reading method, not good and very slow.
know what is the method, the approach of the shape function.
I will try to be inspired by it.
because I need super posed curves.
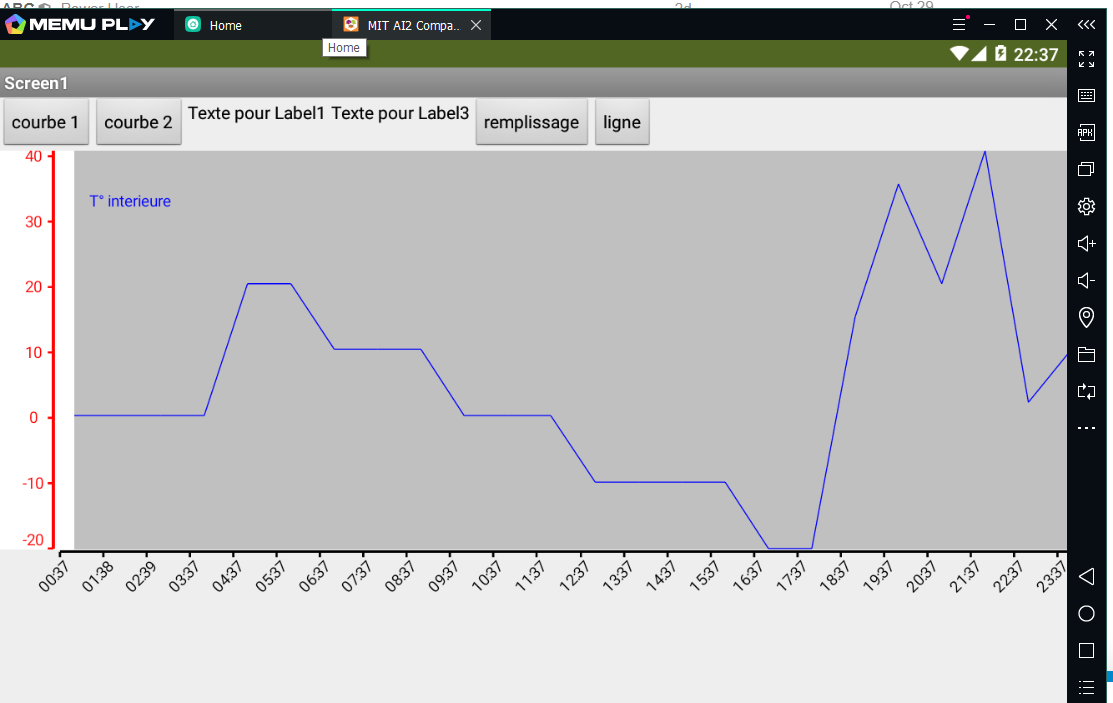
je met un exemple de ma courbe.
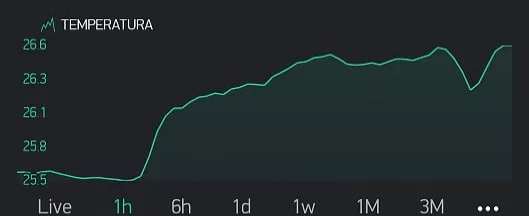
Perhaps consider google charts:
https://developers.google.com/chart/interactive/docs/gallery/areachart
oooooouuuuuuhhhh,
the concern is that I don't have the knowledge to do this without "mit inventory", moreover my app must be totally autonomous, because I don't always have a connection.
Then check out the javascript options for charts
thank you for all these links, I have already walked through them, regarding the plotting of the curve I know how to do. What I want to do is coloring with a gradient towards transparent. but I think that with "mit inventor" it is very difficult, otherwise I will be satisfied with a plain color that is a little transparent.
that's why I was hoping for info on the shape function.
how she does to color with the coordinates of the curve, well that's what I think.
a picture speaks more than words thank you for reading.
You can do that (transparent) with the Canvas.DrawShape as described in post #8 when you color fill a polygon made using a pointList; provided you supply a pointList.
When you draw a graph using the Canvas, you do not have a pointList so you cannot use DrawShape. That is why Tim suggests you use a GoogleChart to draw your graph because a Chart can be constructed to color the area under your line graph curve. You cannot do that with DrawShape.
[You can do this (transparent) with the Canvas.DrawShape as described in article # 8 when you color a polygon created using a pointList; provided you provide a list of points.
yes I already succeeded  I just wanted to go a little further.
When you draw a chart using the Canvas, you don't have a pointList, so you can't use DrawShape. This is why Tim suggests that you use a GoogleChart to draw your chart, as it can color the area under your line chart curve. You cannot do this with DrawShape.
If we can do it just provide the start point and the end point and * DrawShape "colors the area of the curve. But I wanted a gradient and this drawshape doesn't because it takes the color only once, you cannot intervene on it.
Thanks for your help
This topic was automatically closed 7 days after the last reply. New replies are no longer allowed.