[Extension] Dynamic graph. Shift left graph. Sinusoidal wave. Bluetooth

Hello friends,

this extension is about drawing a dynamic graph, which scrolls to the left.
sin1

Blocks:

9 Likes

1.- Creation of graph with random values. Shift to the left.

p299Hi_GraficoDinamico.aia (10.7 KB)

3 Likes

2.- Creation of sinusoidal graph. Shift to the left.

p299Hi_GraficoDinamico_2.aia (10.9 KB)

Look at the properties of the extension.
MaxValue: 1000
MinValue: -1000


2 Likes

3.- Arduino. Bluetooth Potentiometer.

p299Hi_GraficoDinamico_3.aia (11.4 KB)

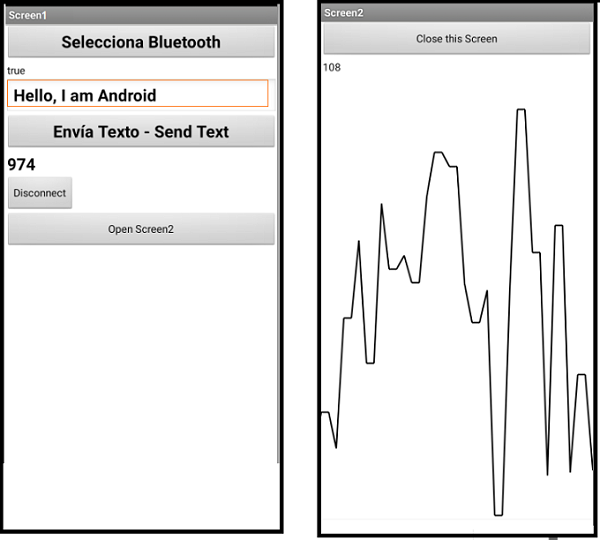
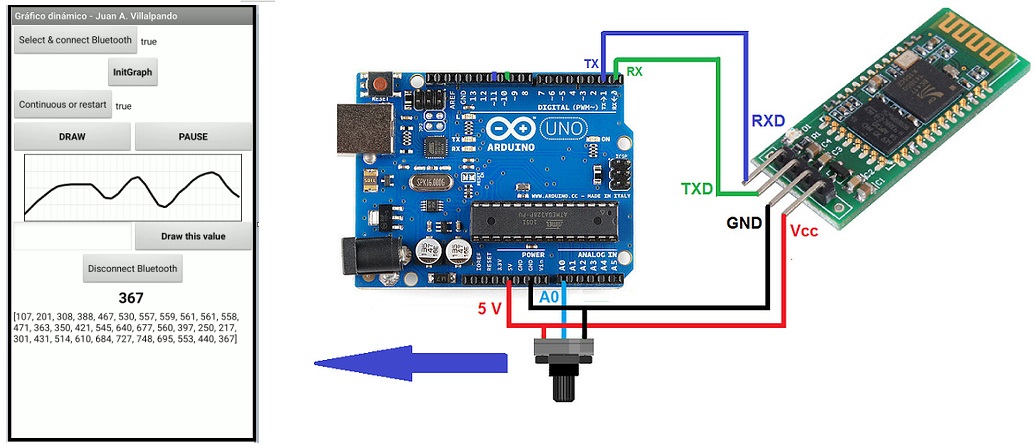
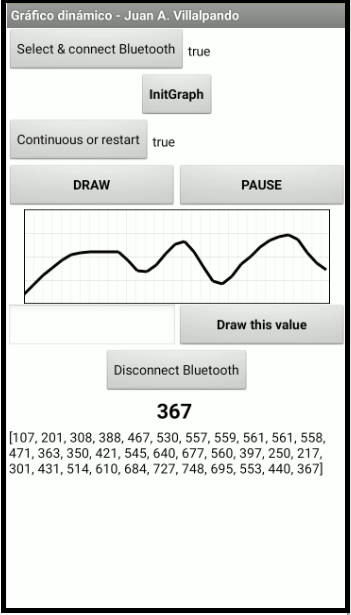
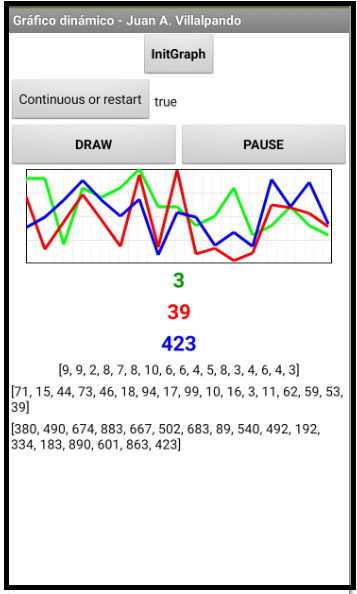
Arduino sends the value of a potentiometer over Bluetooth.

// Juan A. Villalpando
// http://kio4.com/appinventor/299H_extension_GraficoDinamico.htm

int value_pot0;

void setup() { 
  Serial.begin(9600);
}

void loop() { 
    value_pot0 = analogRead(A0);
    // value_pot0 = (int) random(0,1023);
    Serial.println(value_pot0);
    delay(100); // It should be slower than the Clock Interval.
}


4 Likes

4.- Creation of two and three graphs with random values. Shift to the left.

p299Hi_GraficoDinamico_4.aia (11.4 KB)

4B.- Creation of three graphs with random values. Set max and min values. Shift to the left.

p299Hi_GraficoDinamico_6.aia (16.5 KB)

  • If we set the color to 16774127, that graph will not be displayed.
  • We can set the maximum and minimum values ​​of each graph.

Great Extension @Juan_Antonio
:tada:
BTW , is this HC-05 bluetooth module?

Actually if its a HC-05 module it, there is KEY pin :sweat_smile: :joy:, it looks like a different variant of it...

HC-05 and HC-06 here

1 Like

Great job Juan Antonio !!! :hugs: :+1: :muscle:
To do the same I was using a canvas split in two sections (a left one , mirroring the right one) but the effect was not continuous like yours (i.e. such as a scrolling track on an oscilloscope). Thanks a lot: this will be a big improvement in my "digital HUD" for my old convertible.
Cheers, Ugo.

1 Like

(added to FAQ)

Amazing job @Juan_Antonio!
I have implemented similar moving real-time graphs using the timers and recursive draw functions, but this extension would make the process so easier!

5.- Screen1 to connect. Screen2 to view data.

p299H_GraficoDinamico_5.aia (12.6 KB)

:house: The application must be installed

  • Screen1 to select and connect Bluetooth.
  • Screen2 to view data graphic with an extension.
  • We can go from one Screen to another without losing the connection.

Screen1.

Screen2.

// Juan A. Villalpando
// http://kio4.com/appinventor/299H_extension_GraficoDinamico.htm

#include <SoftwareSerial.h>
SoftwareSerial BT(2,3);

String texto = "";

void setup(){
 BT.begin(9600);
 Serial.begin(9600);
}
 
void loop(){
  // Send random every 800 ms.
  delay(800);
  texto = (String) random(0,1000);
  // Serial.println(texto);
  texto = texto + '\n';
  BT.write(texto.c_str());

  // If receive BT, write.    
  if(BT.available()) {
    Serial.write(BT.read());
    }

  // If Serial Monitor, send data by BT
  if(Serial.available()){
    texto = Serial.readStringUntil('\n');
    texto = texto + '\n';
    BT.write(texto.c_str());}
}
  • Sketch sends random every 800 ms. by BT.
  • You can write a number on Serial Monitor and send it by BT.
  • You can write a text in the app and send it to Arduino by BT (check Serial Monitor).
3 Likes

(added to FAQ)

Hello dear ,
I want to stop the shifting at a certain point .. how to freeze it ? Like my Arduino sensor is sending bell shape once it hits back the zero Y I want to stop it ? I see we have two options , either one screen … no shift or keep going shift left forever … how can I stop the graph as is at a certain point ? … thank you so much for your help

You can do the control on the Arduino,

(schematic code:)
if valueinArduino = 0 then sendtoapp 999999

Then in App
if ReceiveText = 999999 then Clock.Enabled=false

thank you so much .. working like a charm ! ... now i have full control of it except i am missing the following:
1- my horizontal x line can be 2 min or 2 hours ... if i need both cases to be in ONE screen .. how can i change X scale according? (before i start plotting i do not know in advance if it will be 2 min or 50 min or 2 h ..) ... can i zoom in out ? like using two fingers to change x scale ?

2- lets say case one above is not possible and my x for one screen wide of my cell is 10 staps while my graph is 30 steps ( like 3 screens wide) once graph done .. can i scroll right - left to see the whole graph in the 3 screen width?

btw i tried changing the kio4 dynamicgraph.resolution > to Slider1.thumbposition which works fine with NEW upcoming data to be plotted, not the previously plotted data.

6.- Save all values in a List. Show graph with saved values.

p299Hi_GraficoDinamico_7.aia (18.4 KB)

Save all the values ​​in a list.
Pause.
Using a Slider to display graphics on the Canvas with the saved values.

thank you
google chart means my cell must be connected to internet right ? .. i mean if i need it to plot the graph offline (i am using bleutooth to arduino) .. can i save the google js file at the arduino then that file will generate the grapf without need of uploading it to google chart live?.. possible?
thank you

Files in app, check:
http://kio4.com/appinventor/169D_javascript_graficos.htm

1 Like