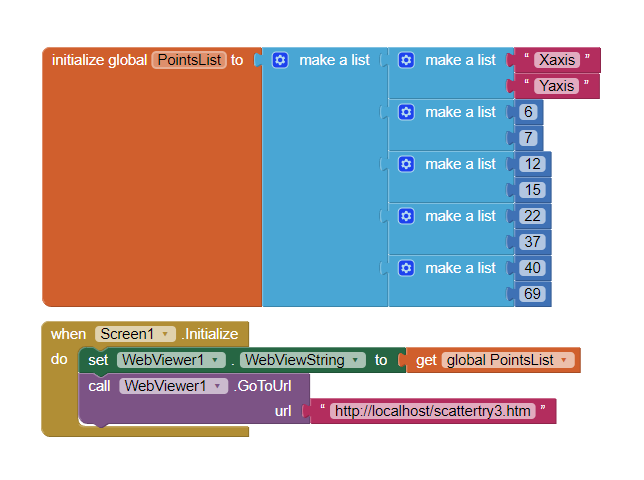
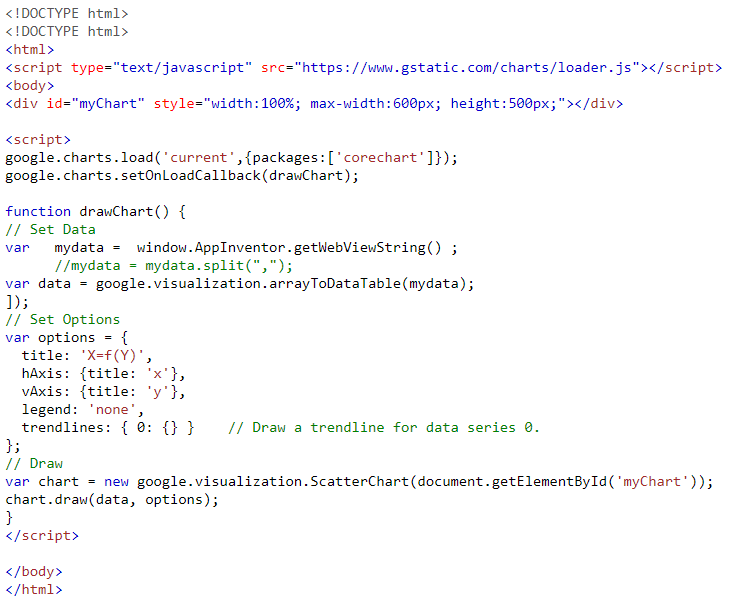
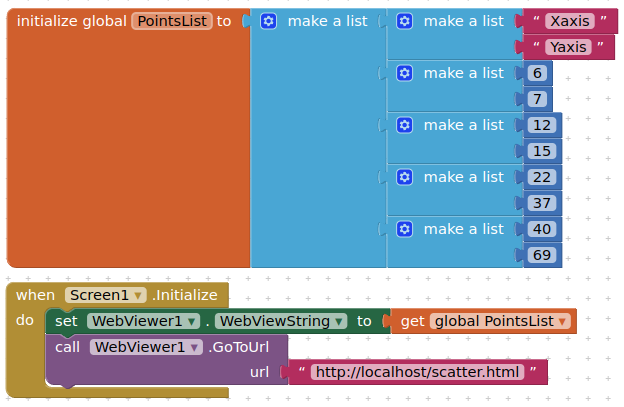
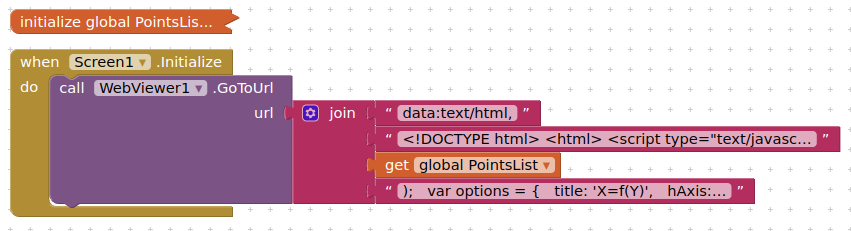
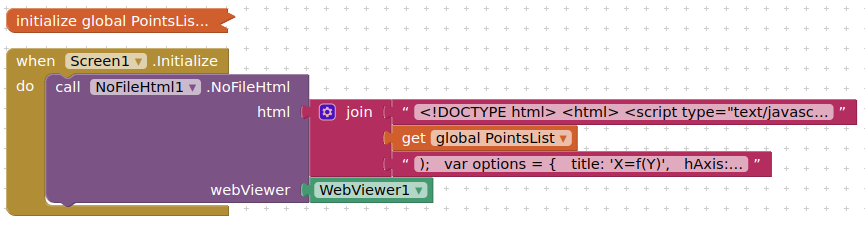
I try to use google charts with the webviewer. There is no problem rendering the chart when the data is in the script but when i try to pass my data it cant render. Can anyone find the problem here?
Your issue is that the webviewstring can only handle, erm, strings.
You are setting the webviewstring with a list (an object). You can decode the list by setting it to a label, but then you have a stringified json. You will need to convert this to a json array once it arrives in the google chart script.
In my opinion what I will do is, i will store data in Google sheets and create a chart in Google sheets itself and Use the Chart URL in web viewer, which will be dynamic and the Chart gets updated automatically every 5 minutes
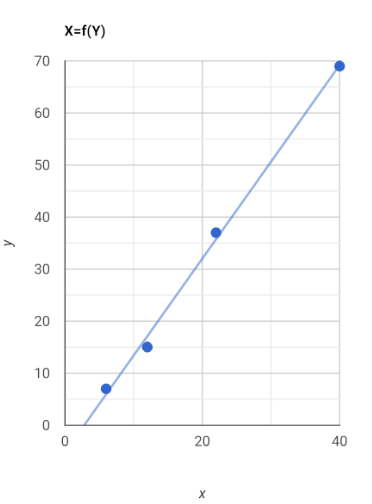
I try to make an app for the school science lab. The user, inserts the measurements and he/she will see the scatter plot and the regression line. There is no problem with the rest of the code except for the part of transferring the data of the table to the javascript, so I will send you just that part.
Thanks in advance.
Sorry for the delay, real world things to attend to.
The webviewstring is converting the list to a string automatically, however we need to convert what was a list into a JSON array for the chart to work. We do this with JSON.parse.
Just to round this off, another method you can use is setting a data uri for the html in text blocks and using the list directly. You must ensure that you do not have ANY html or javascript comments in your html content.
So you just have to split the html file (string) where you want to pass the values of your variables . And this time you dont have to use the JSON.parse method. Very nice !