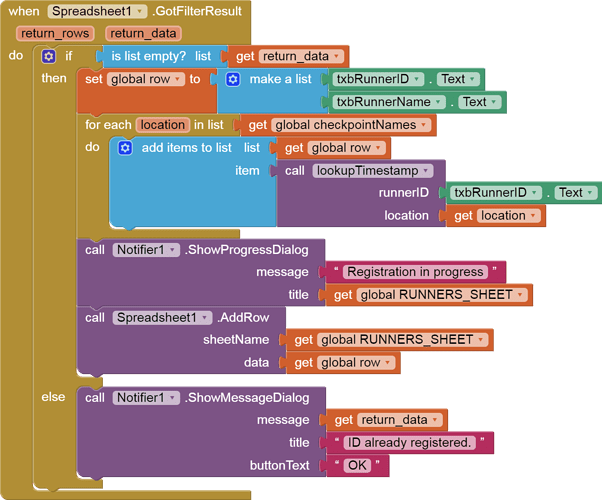
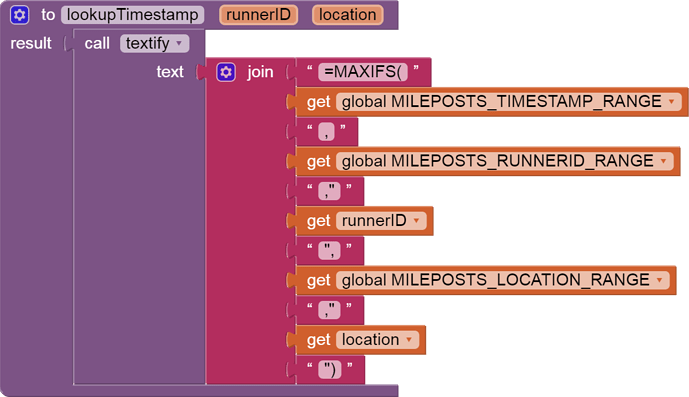
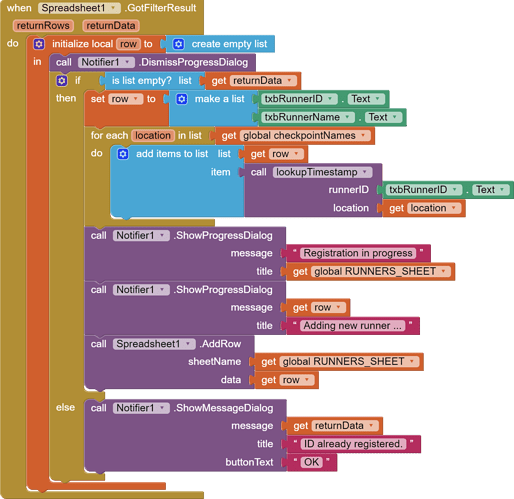
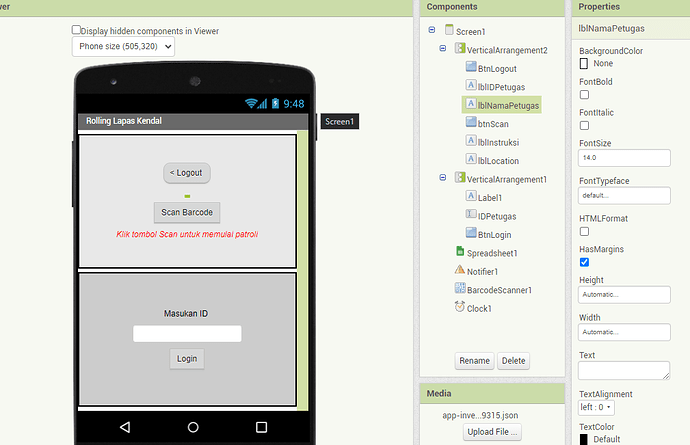
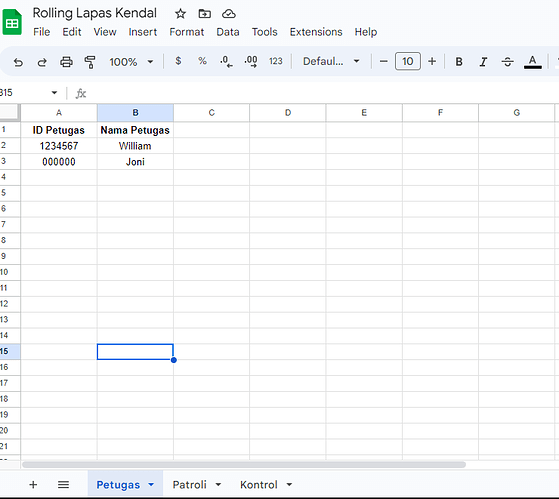
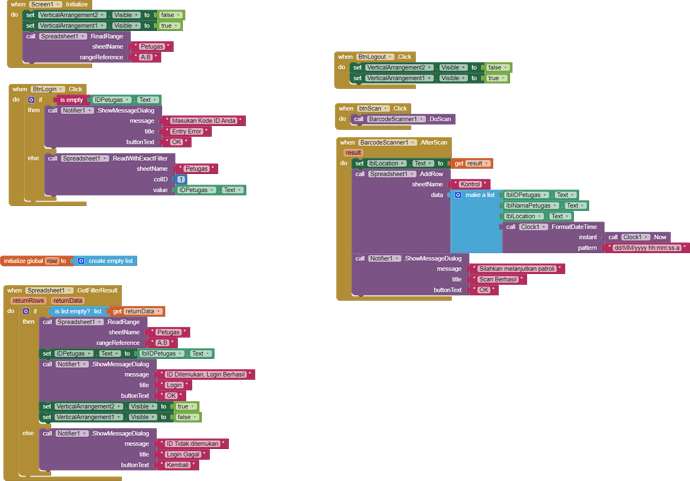
This sample is intended to show how to use Google Sheets aggregation functions like MAXIFS to summarize multirow log data into single line summaries.
This sample uses the New York City Marathon as a base, though it probably can't scale to the 53,000 runners.
It is based on three sheets:
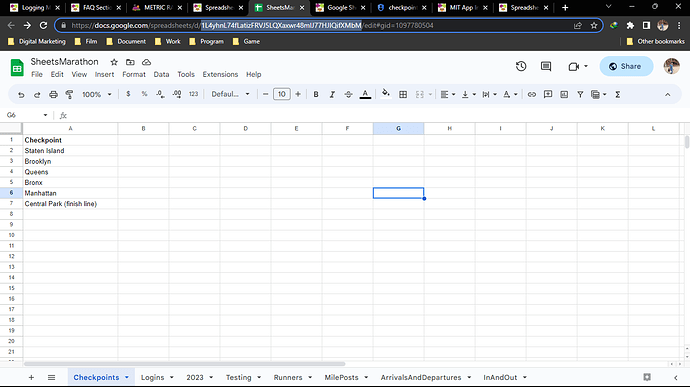
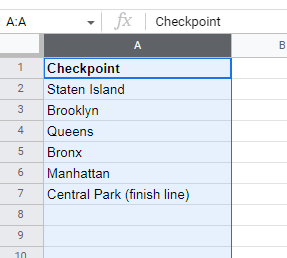
- Checkpoints, a list of locations each runner must cross on his route
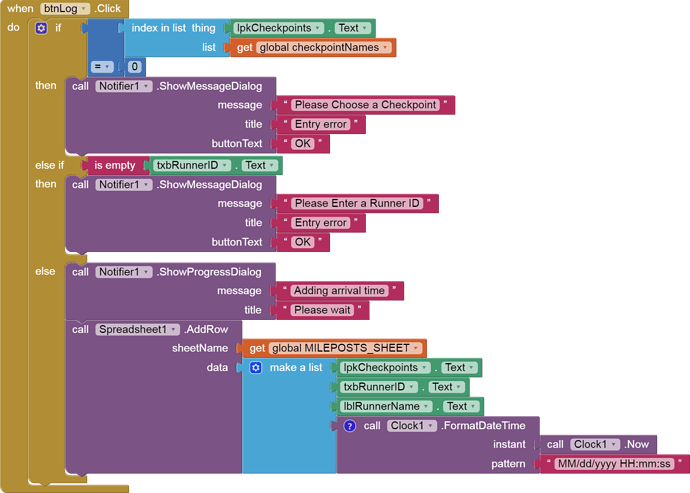
- Mileposts, a detail list of runner checkpoint timestamps
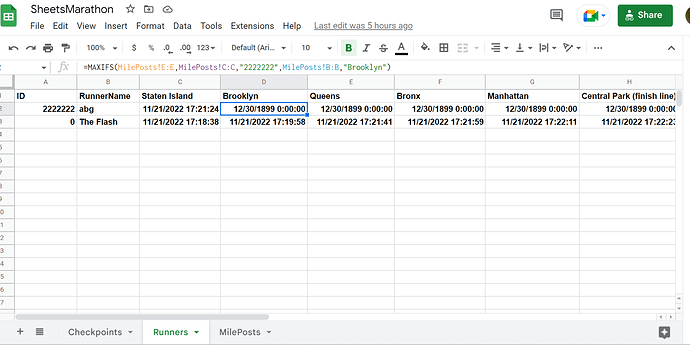
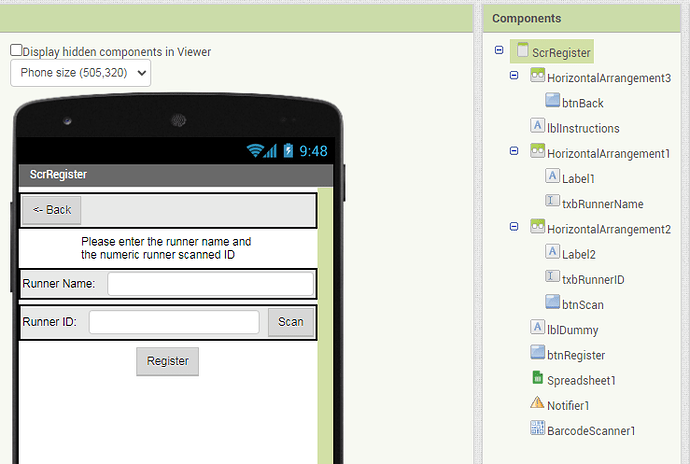
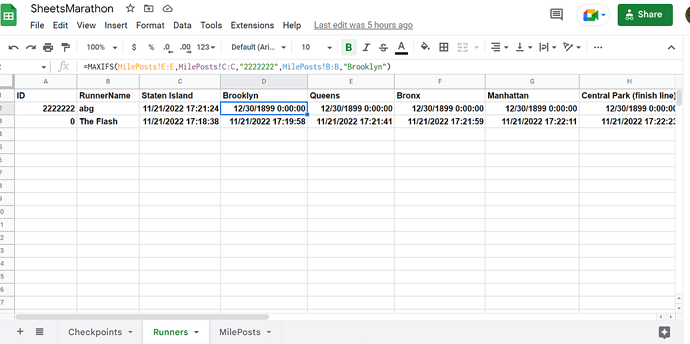
- Runners, a master list of runners, with identifying bar codes and stats
Checkpoints (reference only)
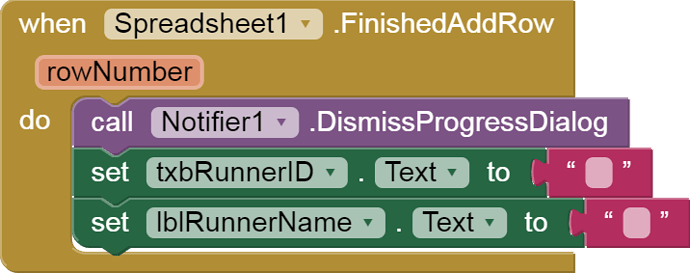
MilePosts details (one row per runner per checkpoint passage)
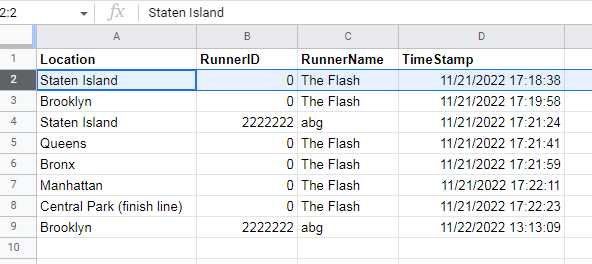
I only bothered with two runners:
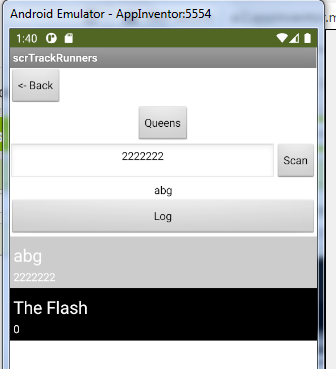
- abg (runnerID 2222222), who took a day to get from Staten Island to Brooklyn, but no further
- The Flash (runnerID 0), who used his super speed to cover the entire course in 4 minutes.
The summarizations are kept with the runner records in the Runners sheet:
The summarizations are timestamps gathered from the MilePosts details using the MAXIFS() function.
The Google Sheet:
Aggregation functions are useful to track:
- progress of items through a manufacturing or shipping process
- Inventory levels at various locations, based on SUMIFS aggregations of inventory transfers.
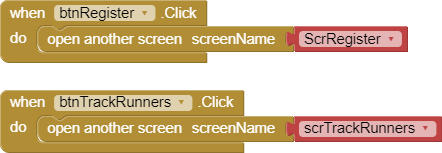
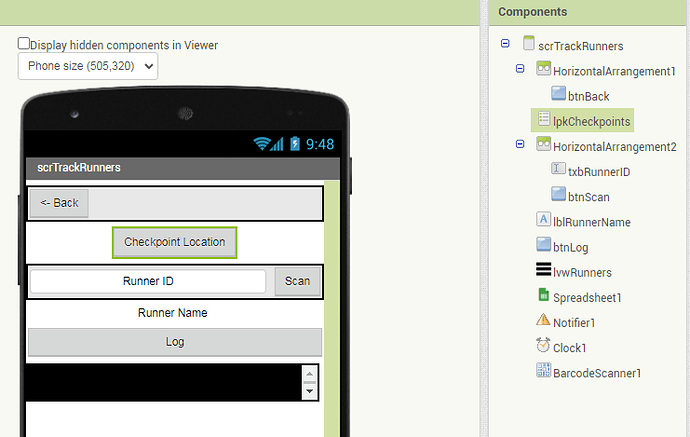
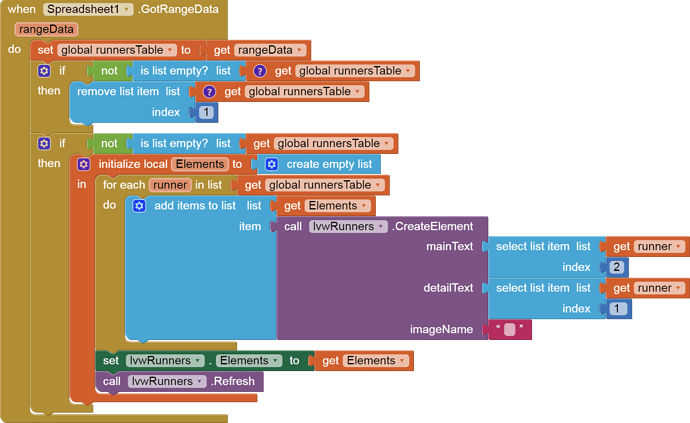
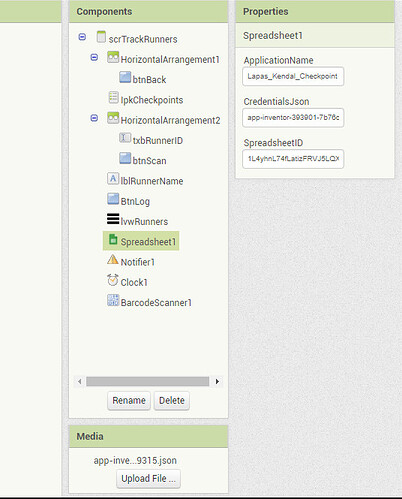
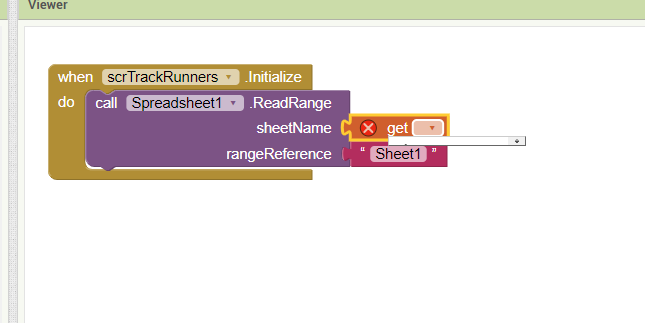
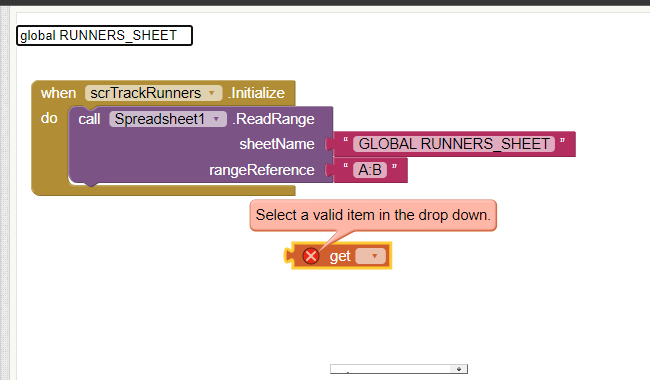
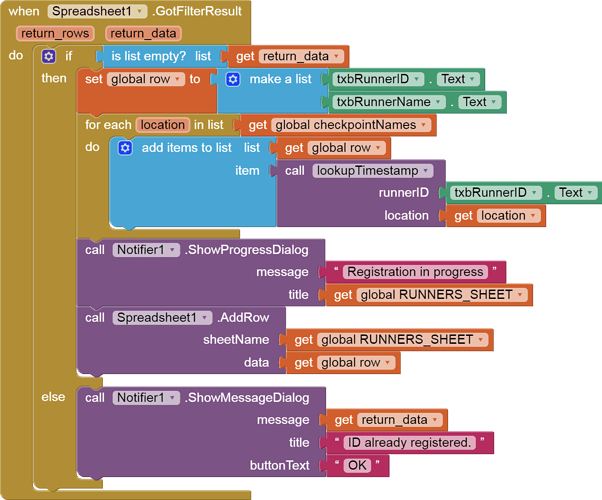
The remainder of this tutorial will cover details of how to implement this app using the AI2 Spreadsheet component.
