I'm supposed to do that in Google Sheets right?
You need at least 2, maybe three sheets:
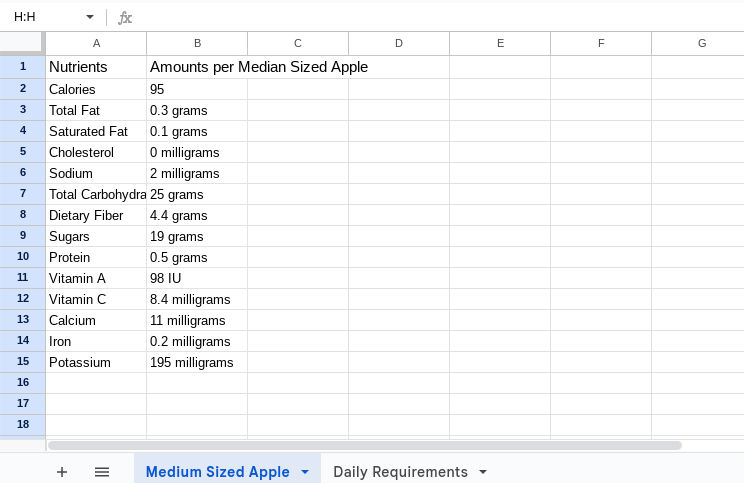
- a reference table where you can look up all the different nutrients in any particular unit (medium size apple) of food
- a daily log of the different foods and their quantities that were consumed, padded with the lookup values from the reference table
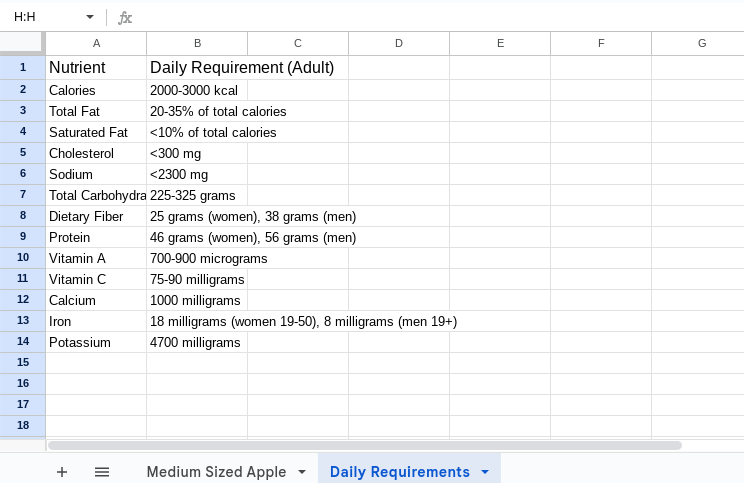
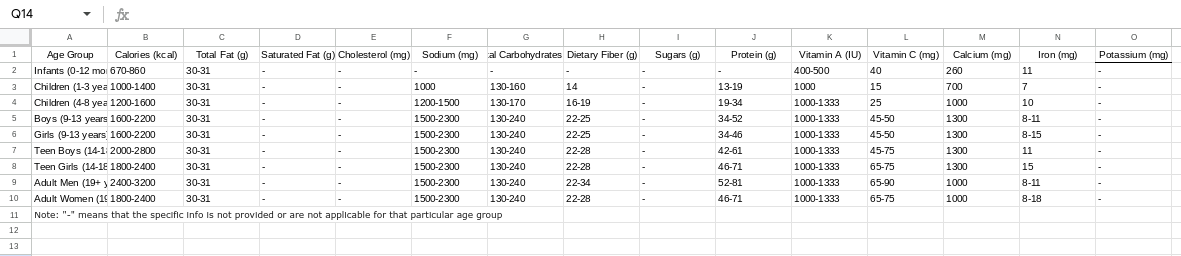
- a reference table listing the different types of nutrients and their minimum daily requirements.
Each table would be a separate sheet, with its own headings and primary key.
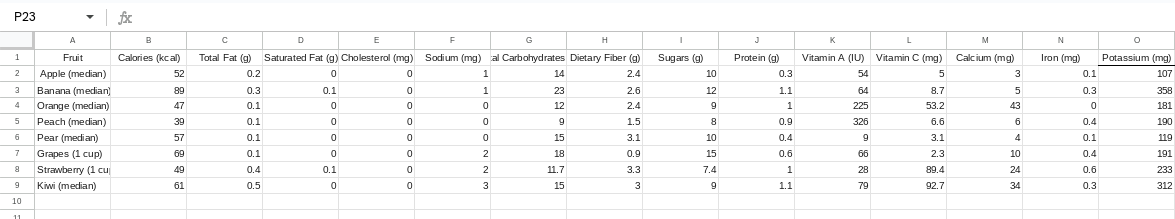
That design would have too many sheets, for so many types of food.
Instead, turn those 15 rows into columns, and fill in one row per food, all in the same sheet.
Each additional food type should be an extra row.
1 Like
Now you are ready for the third sheet, the detailed food log by date (and person if tracking multiple people).
The food log looks like the first sheet, except it has three extra columns at the left:
- the person's name and category of person
- the date of his consumption
- the type of food
- how much of that food he ate
The calories, fat, etc columns in each row could be multiplied by the quantity to get the contribution of that food to his daily consumption.
1 Like
Do I just make the names and their data randomly or am I just supposed to set up the sheet?
This sheet needs its headings.
Past that, you would have to write the app to feed it new rows as the user(s) eat.
No one would complain if you add a few test users and their fake consumption.

That looks good.
Now you have two alternative ways to sum and group by user and date:
- by Google Sheets expressions in a separate summary sheet
- in your app, using advanced list filtering and sorting and grouping blocks.
It would not hurt to study both.
Could you please walk me through the steps because I am new to this process.
Do you have the blocks to request input and add rows to the daily sheet yet?
There's no point in working on graphing if you only have tiny data.
Study this sample app to see summation by Google Sheets code:
Is the first step just creating an API for the Google sheet I'm using for the spreadsheet component?
Your first step could be coding an input Arrangement where the user could input values for columns A,C,D,E of the sheet you have at How do you import data from chatbot to bar graph automatically? - #19 by XIN_TONG_ZOU, fill in the rest of the columns based on those given textbox.Text contents, (table lookups and maybe some math needed here), then do a spreadsheet Add Row.
Can you show me how to do it? Sorry, it's my first time.
Do you have an input Arrangement yet in your app, with text boxes and a Submit button?
yes
Do you have TinyDb tags and values for the user to remember his name and body type, and a dialog to set them the first time he uses the app?
You will need a List Picker pre-loaded with the body types as Elements, matching the body types used in your Sheet that lists the body types and their requirements.
What are TingDb tags?
TinyDB is the local phone data base you can use to remember what user is on the app on that phone, and what his body type is.
Without TinyDB, it would be as if your user had amnesia each time he opened the app.