Yes, instead of gauge I will use bar made by canvas as it will be much easier. Thanks ![]()
So please how I can do like this or even circle with increasing the colours and changing the colours with increasing the concentration by ppm
Yes, instead of gauge I will use bar made by canvas as it will be much easier. Thanks ![]()
I can't support JavaScript solutions, though I might collect links to them on this board.
Thanks, I meant how I can make normal bar or circle using canvas to make three layers of notification or alert.
Study the Canvas component.
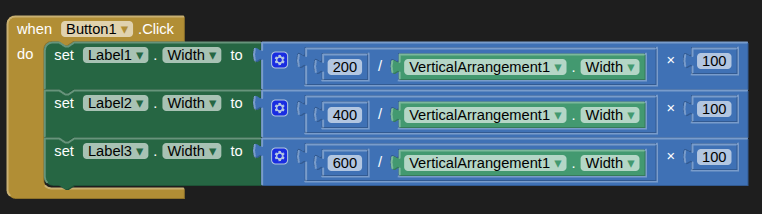
You could always just use three labels (no text) with background colours and set the height/width to match your values
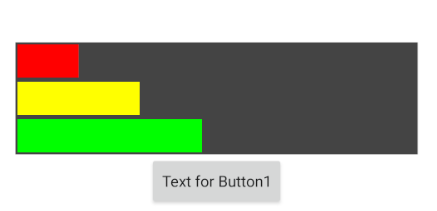
Here is a working multicolor bar graph of the current load on the MIT Build Servers
Note how the bar colors change from green to yellow to red as the load increases.
Thanks. The problem is with the header ((arrow)) going to the left side. please, send me the aia file.
This is very nice.
Thank you so much.
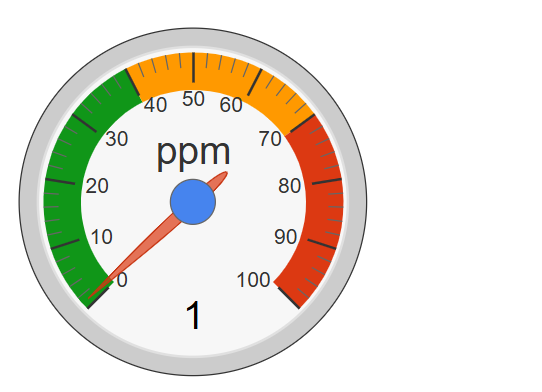
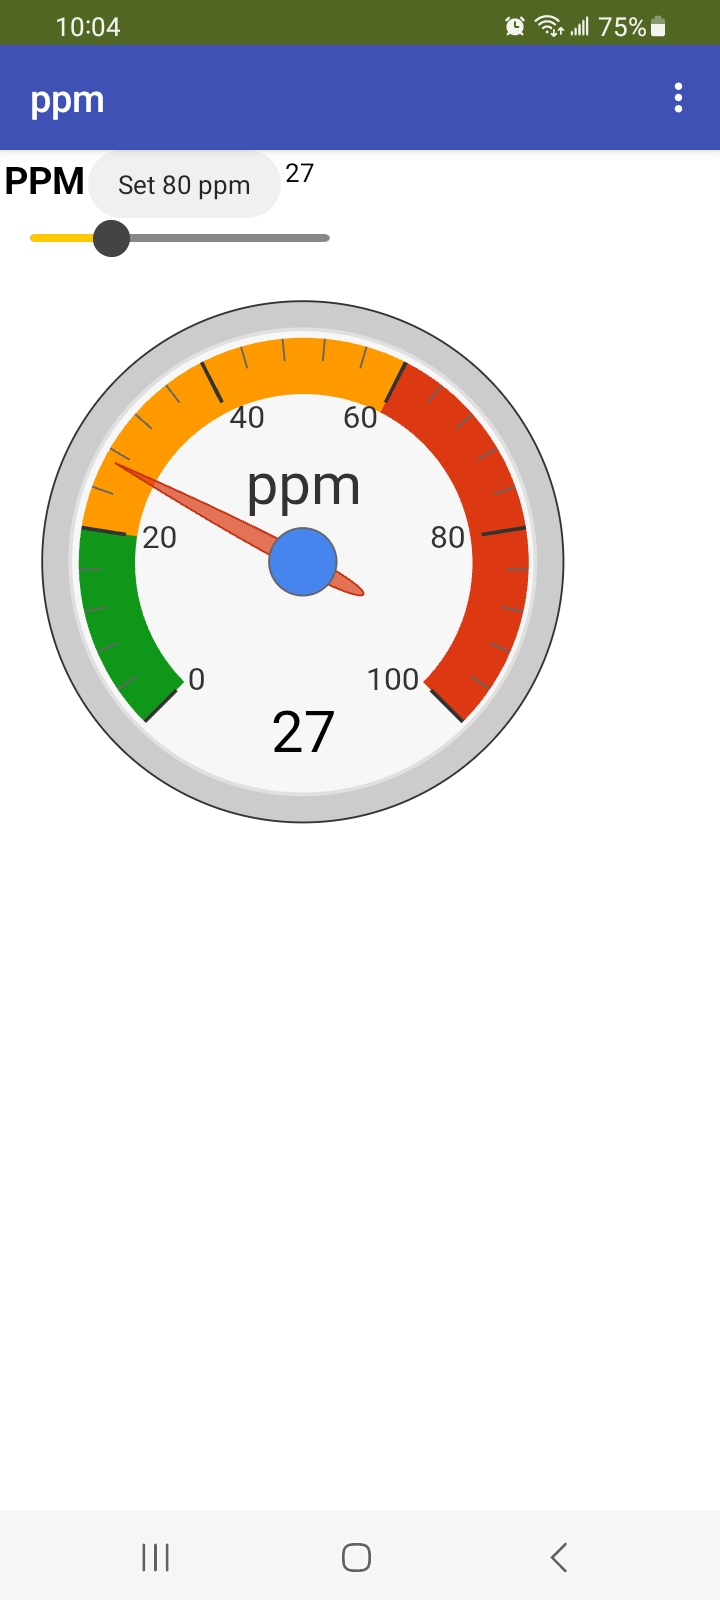
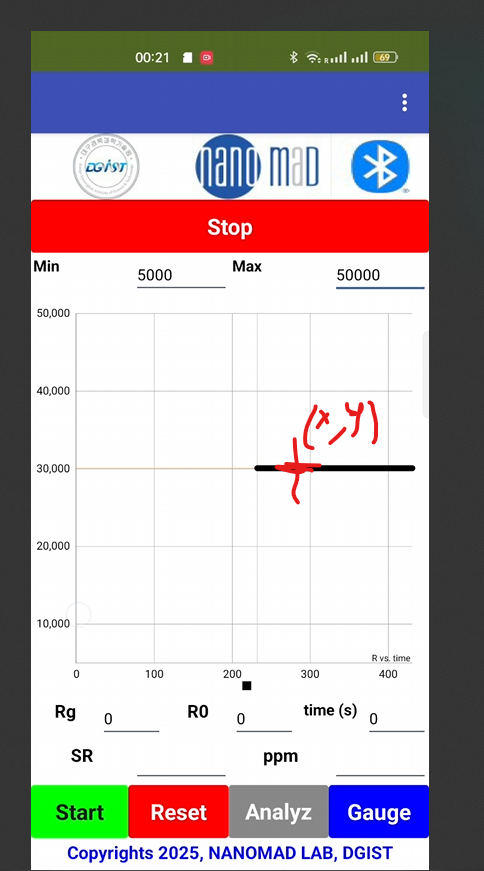
Please, if possible, send me the aia file, as I changed the color ranges and water gauge to ppm, but the header (needle) is not working. Furthermore, I need to change the width and height to fit the app screen. ((Thanks I did it, now it is working))
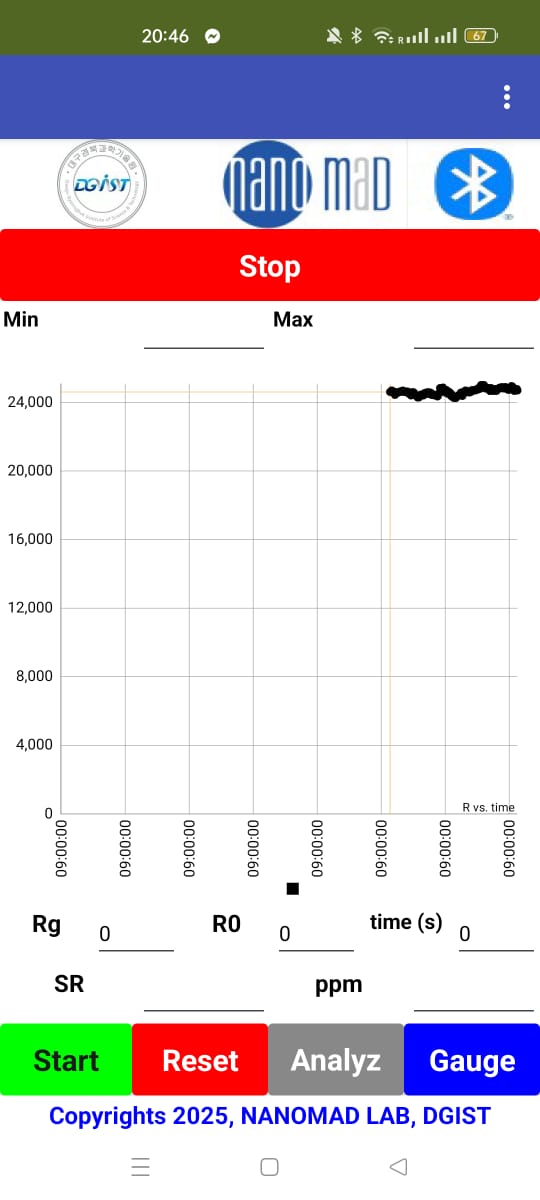
Also, if you please, help me with the x-axis of the chart, as I need it to read only in seconds, not in milliseconds time since 1970.
(Remaining the x-axis in seconds.
Maybe I can send elapsedTimeSeconds on x axis and R_Unknown on y axis, but how I can do it.
Also, if you please, help me with the x-axis of the chart, as I need it to read only in seconds, not in milliseconds time since 1970.
(Remaining the x-axis in seconds.
Maybe I can send elapsedTimeSeconds on the x-axis and R_Unknown on the y-axis, but how can I do it? Please, I have tried many times to make the x-axis as time in seconds.
For the gauge, I need to connect it to ppm math to work automatically in the app.
Also, in the last version of the app, I will take the R y-axis from the math calculation of the Wheatstone bridge, so how can I do it?
BELAL2025NANOMADVERSION7 (1).aia (1.1 MB)
Thanks @ABG Also, now it can analyze the R air and R gas
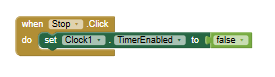
when I press stop, the timer is still counting
ppmGauge.aia (46.7 KB)
Good luck. This should work when connected to your app's ppm data stream.
Modify the GCppm2.html that is stored in media to get the centering of the gauge as you like it. ![]()
I have turned off Windows Defender examination of aia files, so I can examine your aia file.
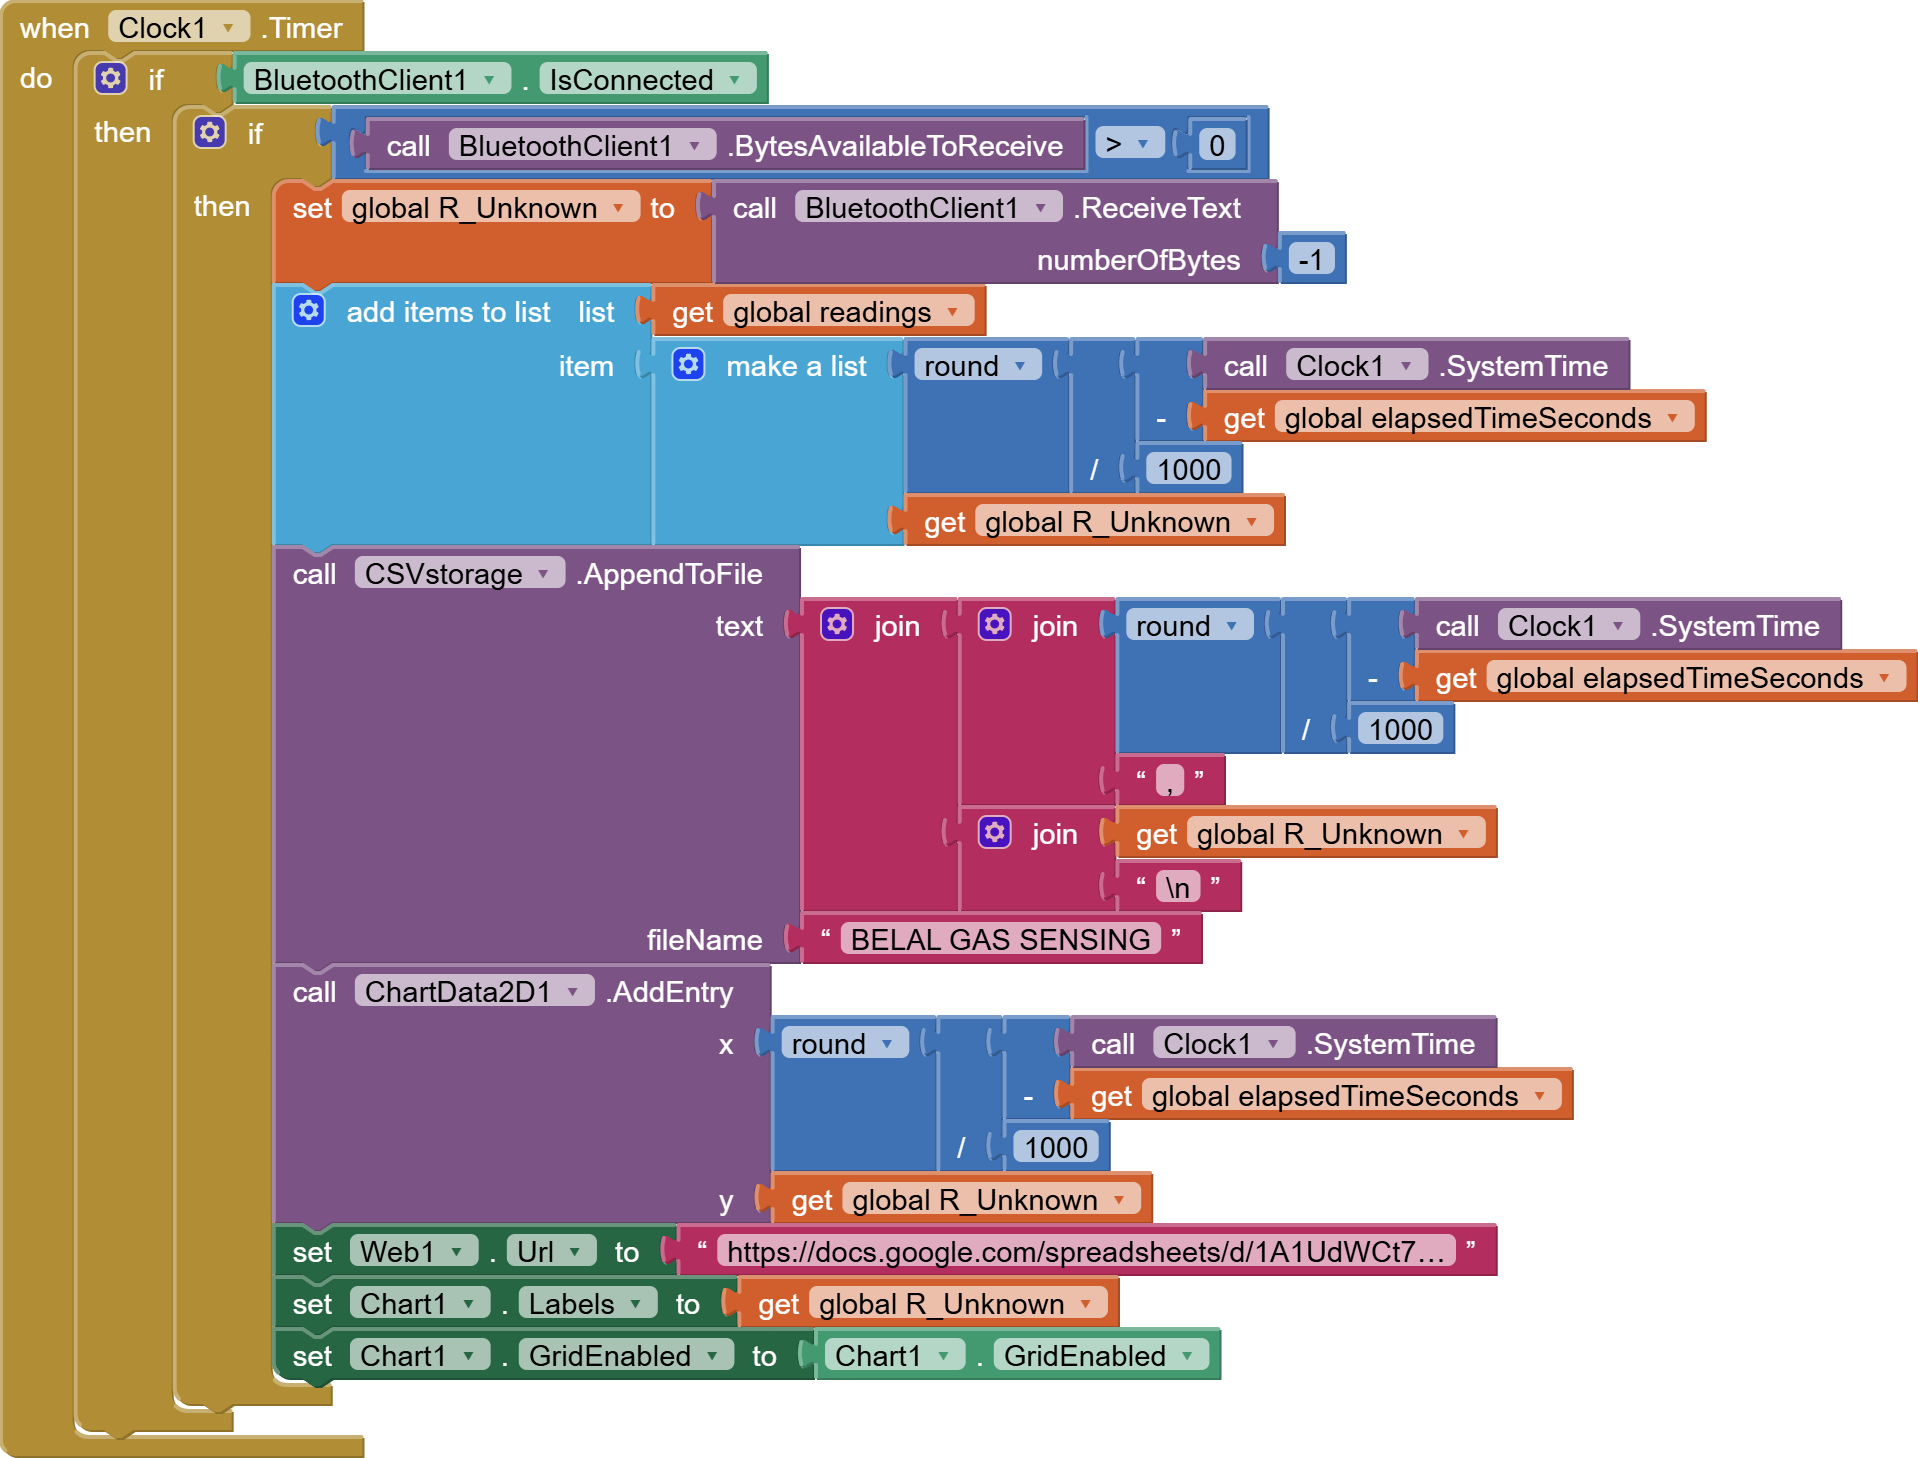
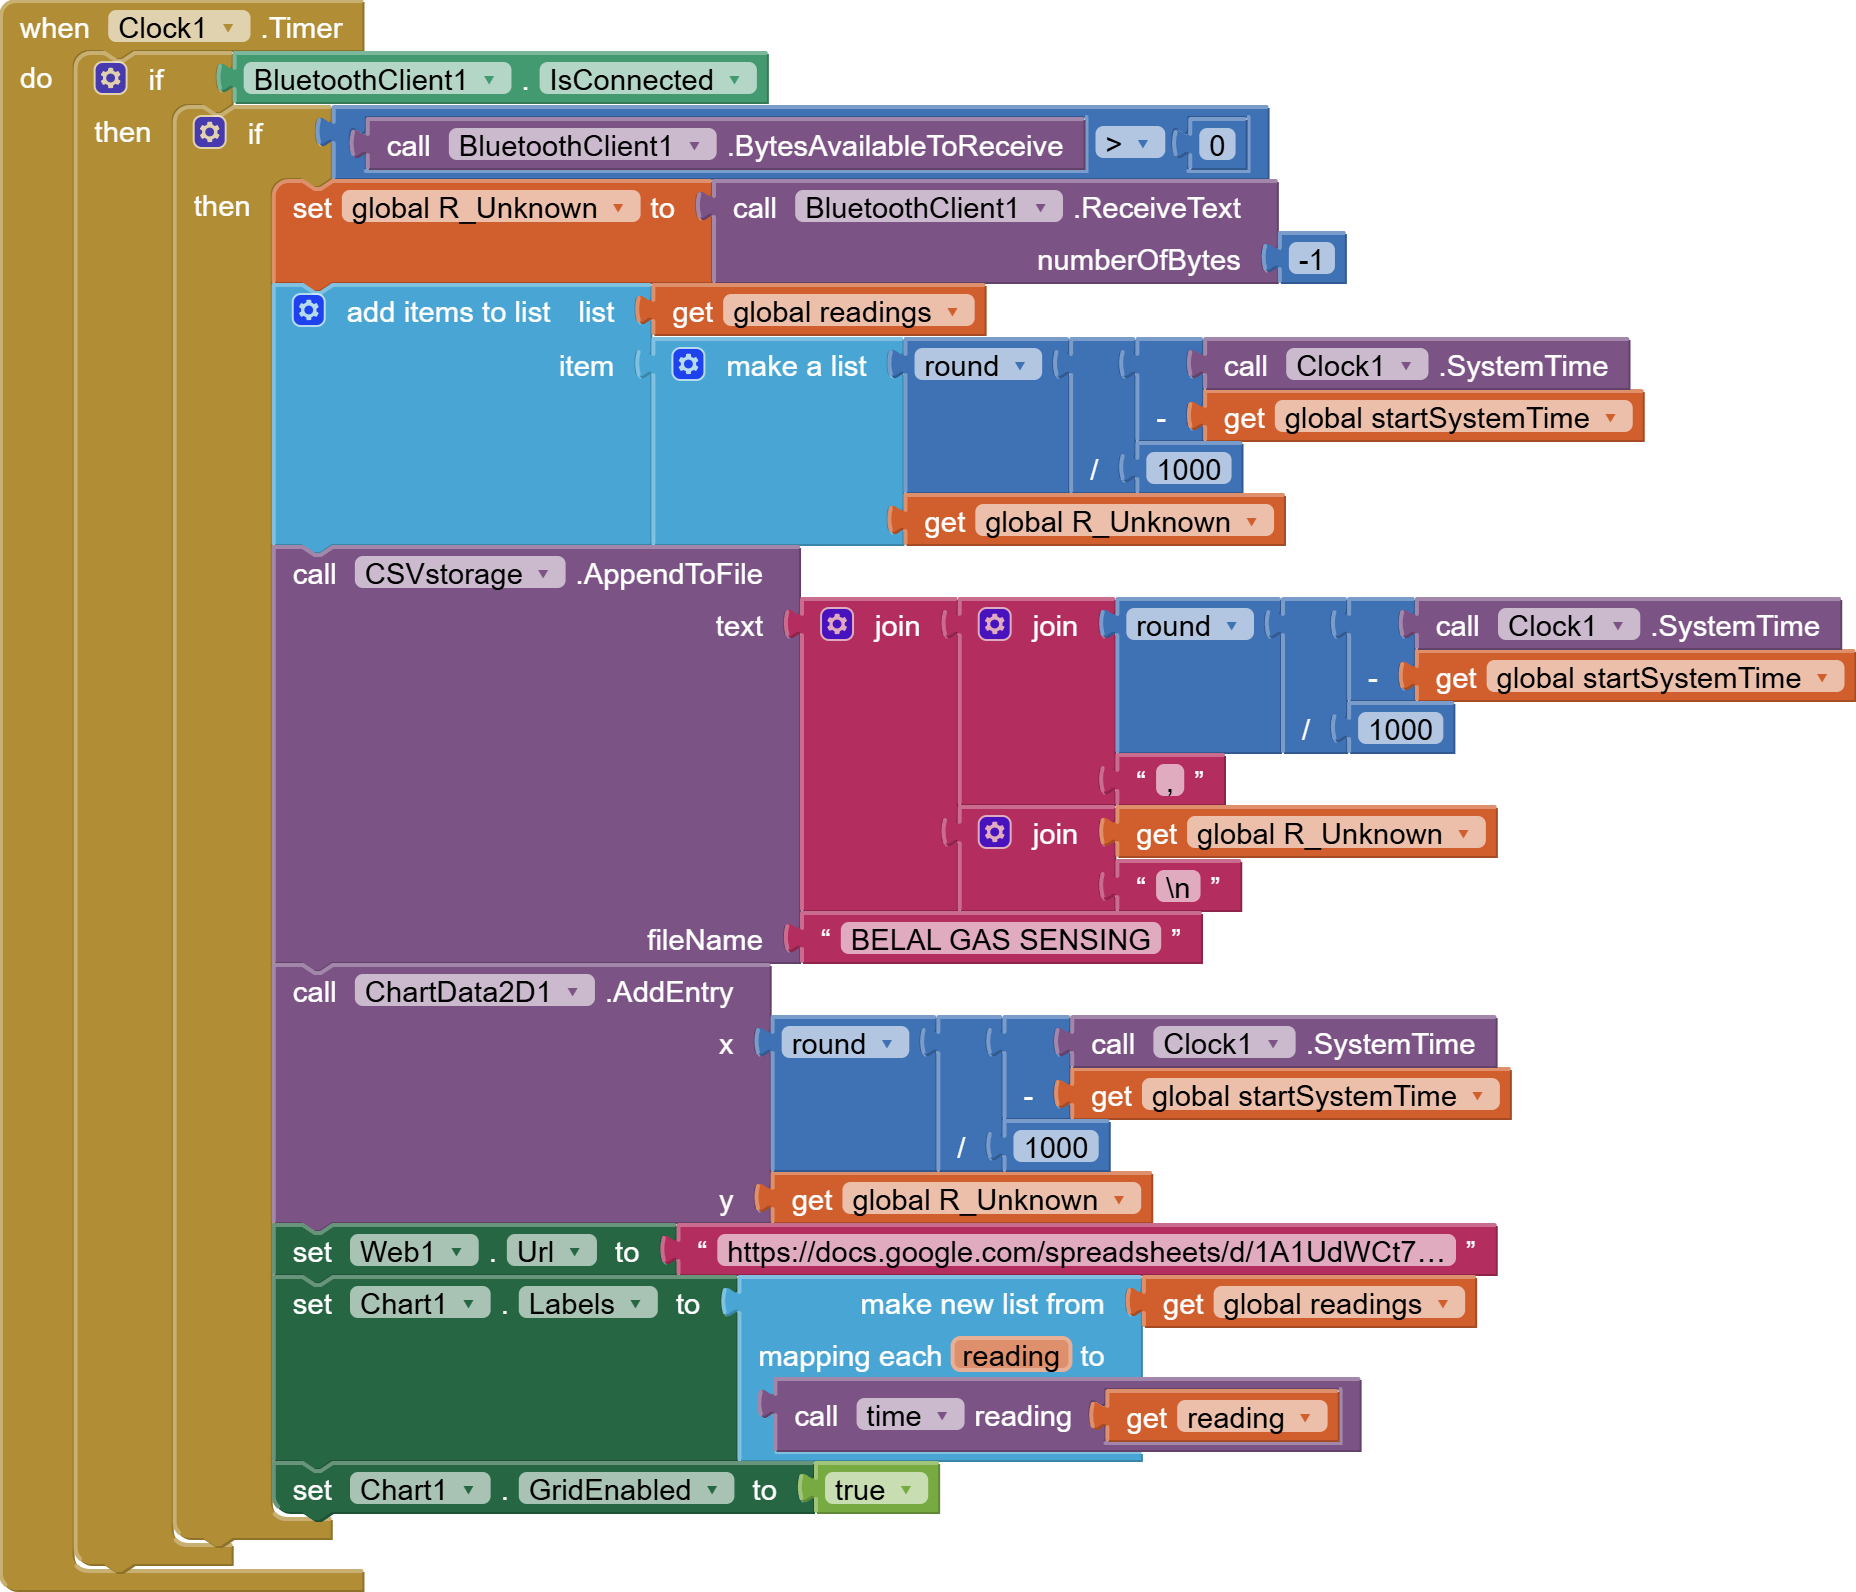
Here is a set of blocks I must change, for readability and correctness:
old:

new:

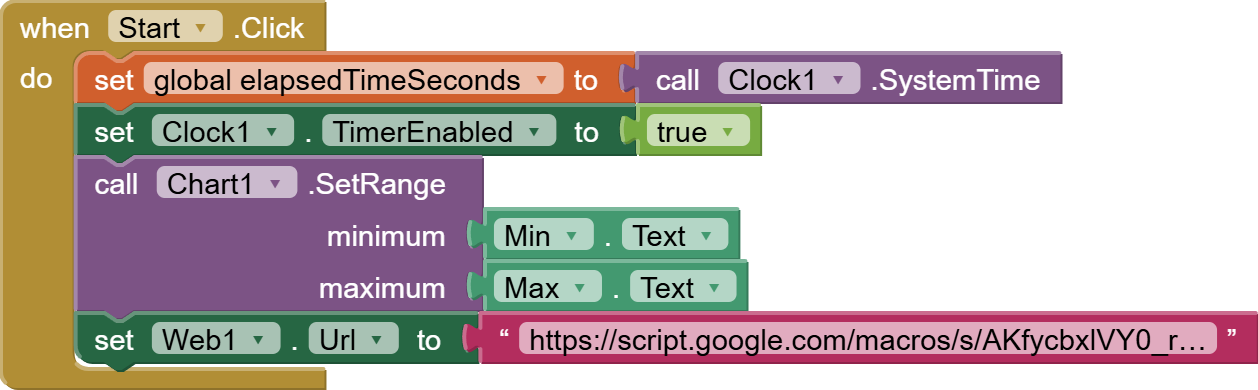
Do you see the difference between elapsed time and absolute System time?
Elapsed means you have subtracted start time from end time to get the difference.
But that is not what is being stored in this variable, as you will see further down.
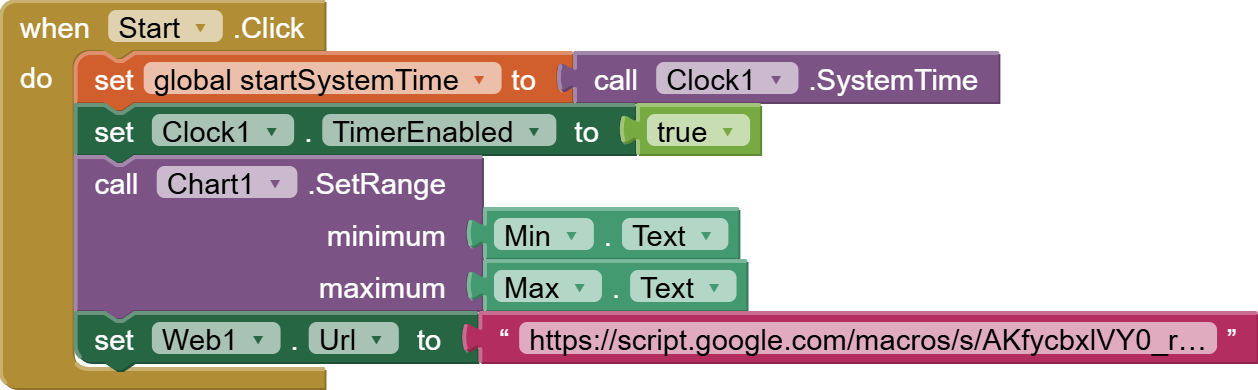
old:
new:
Notice how the global variable name change makes more sense, where SystemTime of start is being subtracted from current SystemTime, giving elapsed milliseconds, then rounded into seconds.
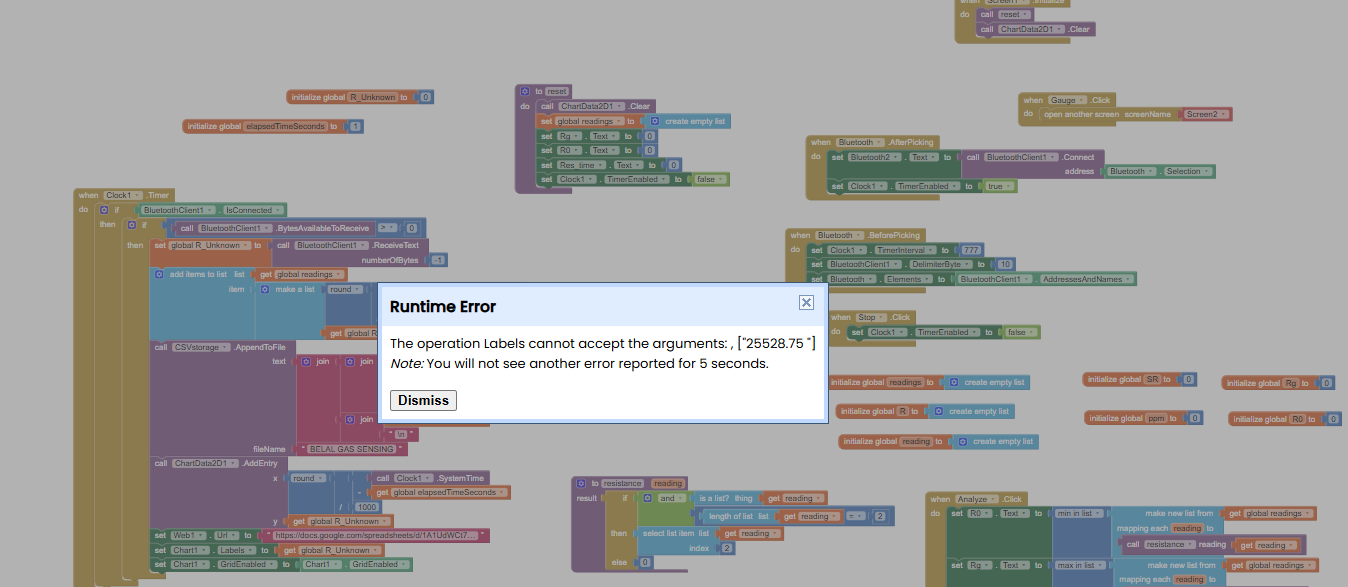
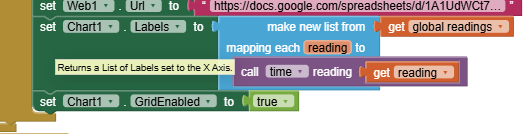
Those seconds are being loaded into item 1 of each (time, R_Unknown) pair in list global readings. That's handy for later, when we need a list of Labels for the Chart.
(I have no idea why you are loading a Web URL. It's not like you are issuing any Web Gets to it. That makes your app look like a product of a cargo cult.)
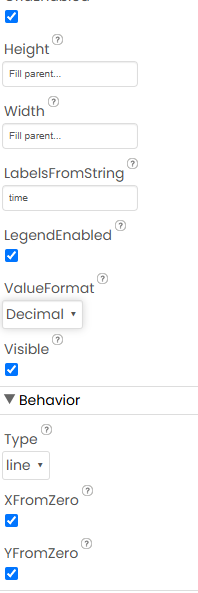
I hovered my cursor over the green Set Chart1.Labels block, to raise its tool tip.
That's how I know it needed a list of x values, and not that R value you had before.
I also set the chart GridEnabled to true, since I am guessing you wanted a grid, from that ineffective block you originally had setting the setting to itself, which would have done absolutely nothing. If you don't want a grid, set it to false.
old:
new (after variable rename):
This should clear the error message on setting Labels.
All blocks are draggable.
I suggest you drag in the init global startSystemTime first, since all the other blocks depend on it.
By the way, I did not correct your file naming convention.
Operating systems expect file names to have suffixes (.text, .json, .csv, .html, .exe, ...) as an aid to knowing what programs eat them.
Since you have written your file to contain text Comma Separated Values (CSV), you should add the suffix .csv to the file name, as a courtesy to the operating system and any one else dealing with that file.
Also, I found this project, which may be helpful for someone who will check this thread in the future.

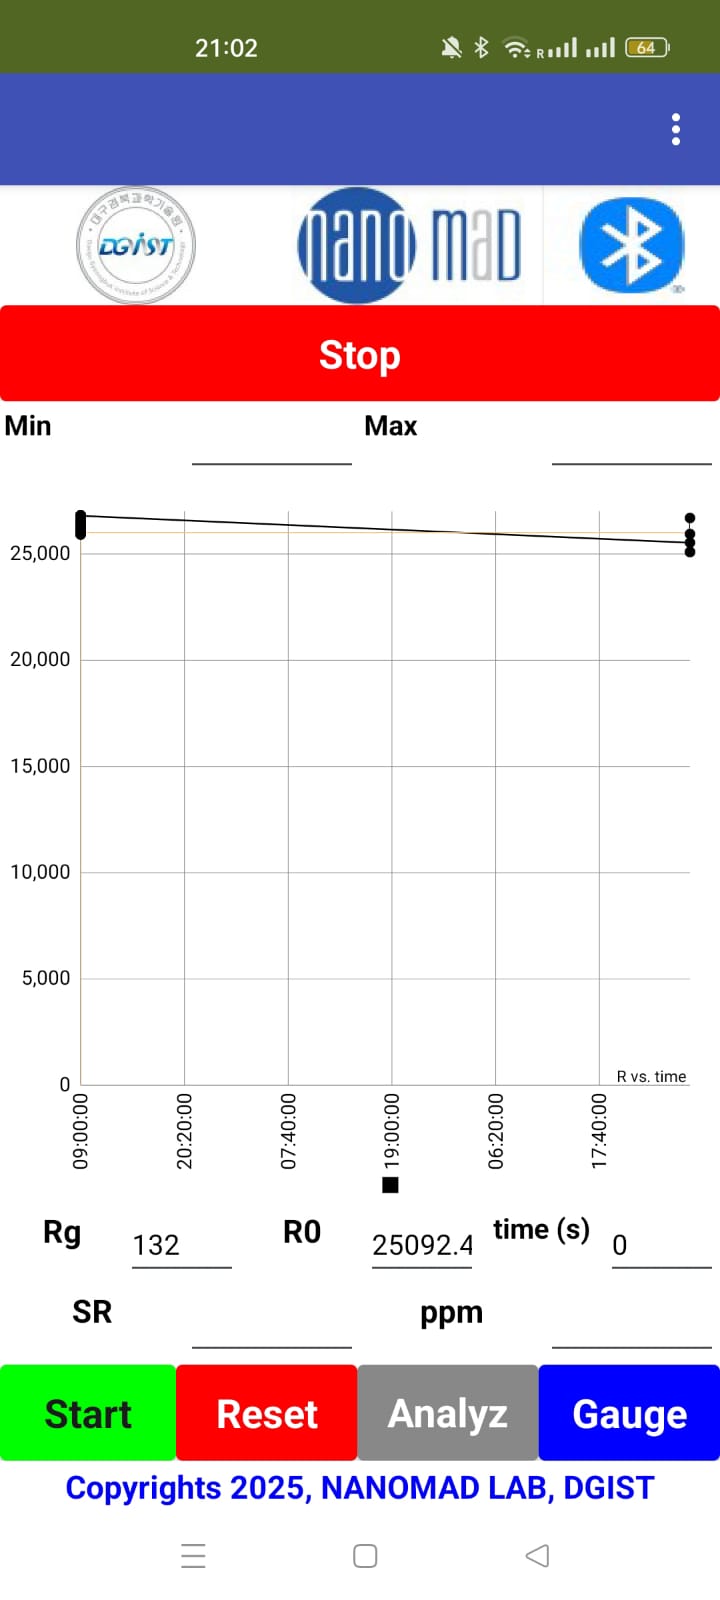
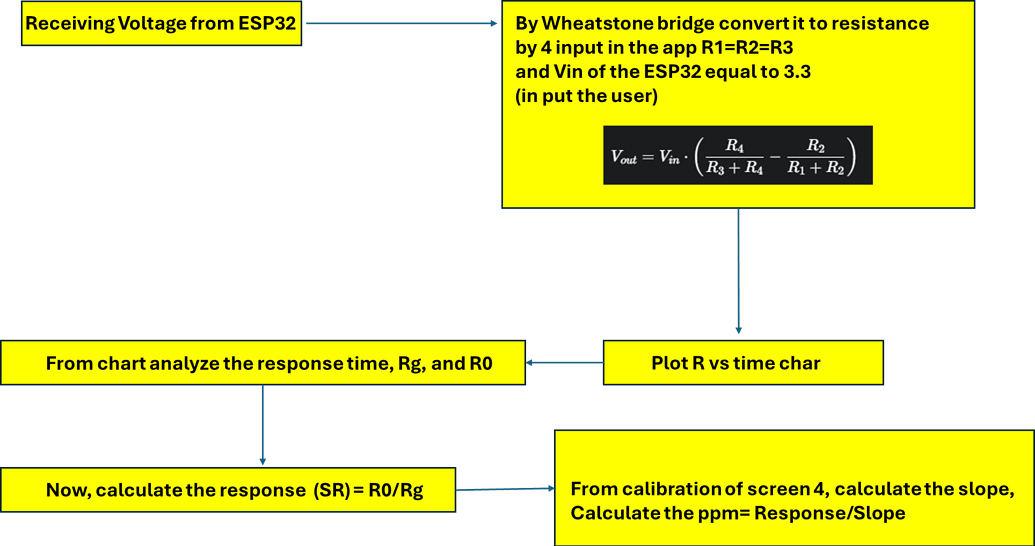
Also, I have a very important question regarding finalizing my project. I will receive voltage from ESP32, and the resistance will be mathematically calculated from voltage by the Wheatstone bridge. After that, the resistance will be plotted to get Rg and Rair by the Analyze button, which has to work by clock, not by pressing, and from them I will get the response by dividing Rg/Rair or Rair/Rg, depending on the gas and material type. Also from the calibration screen, I will get the slope, which will be used to calculate the ppm, and also I need to rotate the gauge automatically. So how can I do it? Should I save the data first in a CSV file and call it in the app, or what should I do? Also, I checked screen4, and it's still crashing.
BELAL2025NANOMADVERSION7_copy_copy.aia (1.1 MB)
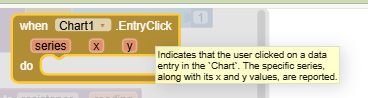
EntryClick(series,x,y)
Indicates that the user clicked on a data entry in the Chart. The specific series, along with its x and y values, are reported.
How can I use this event?
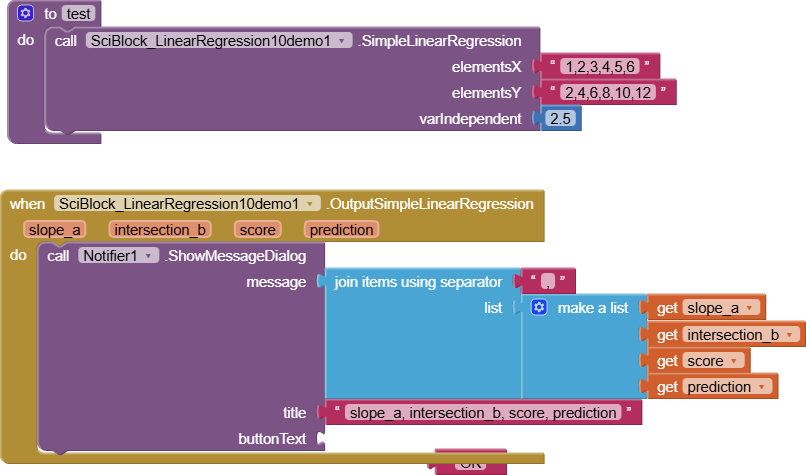
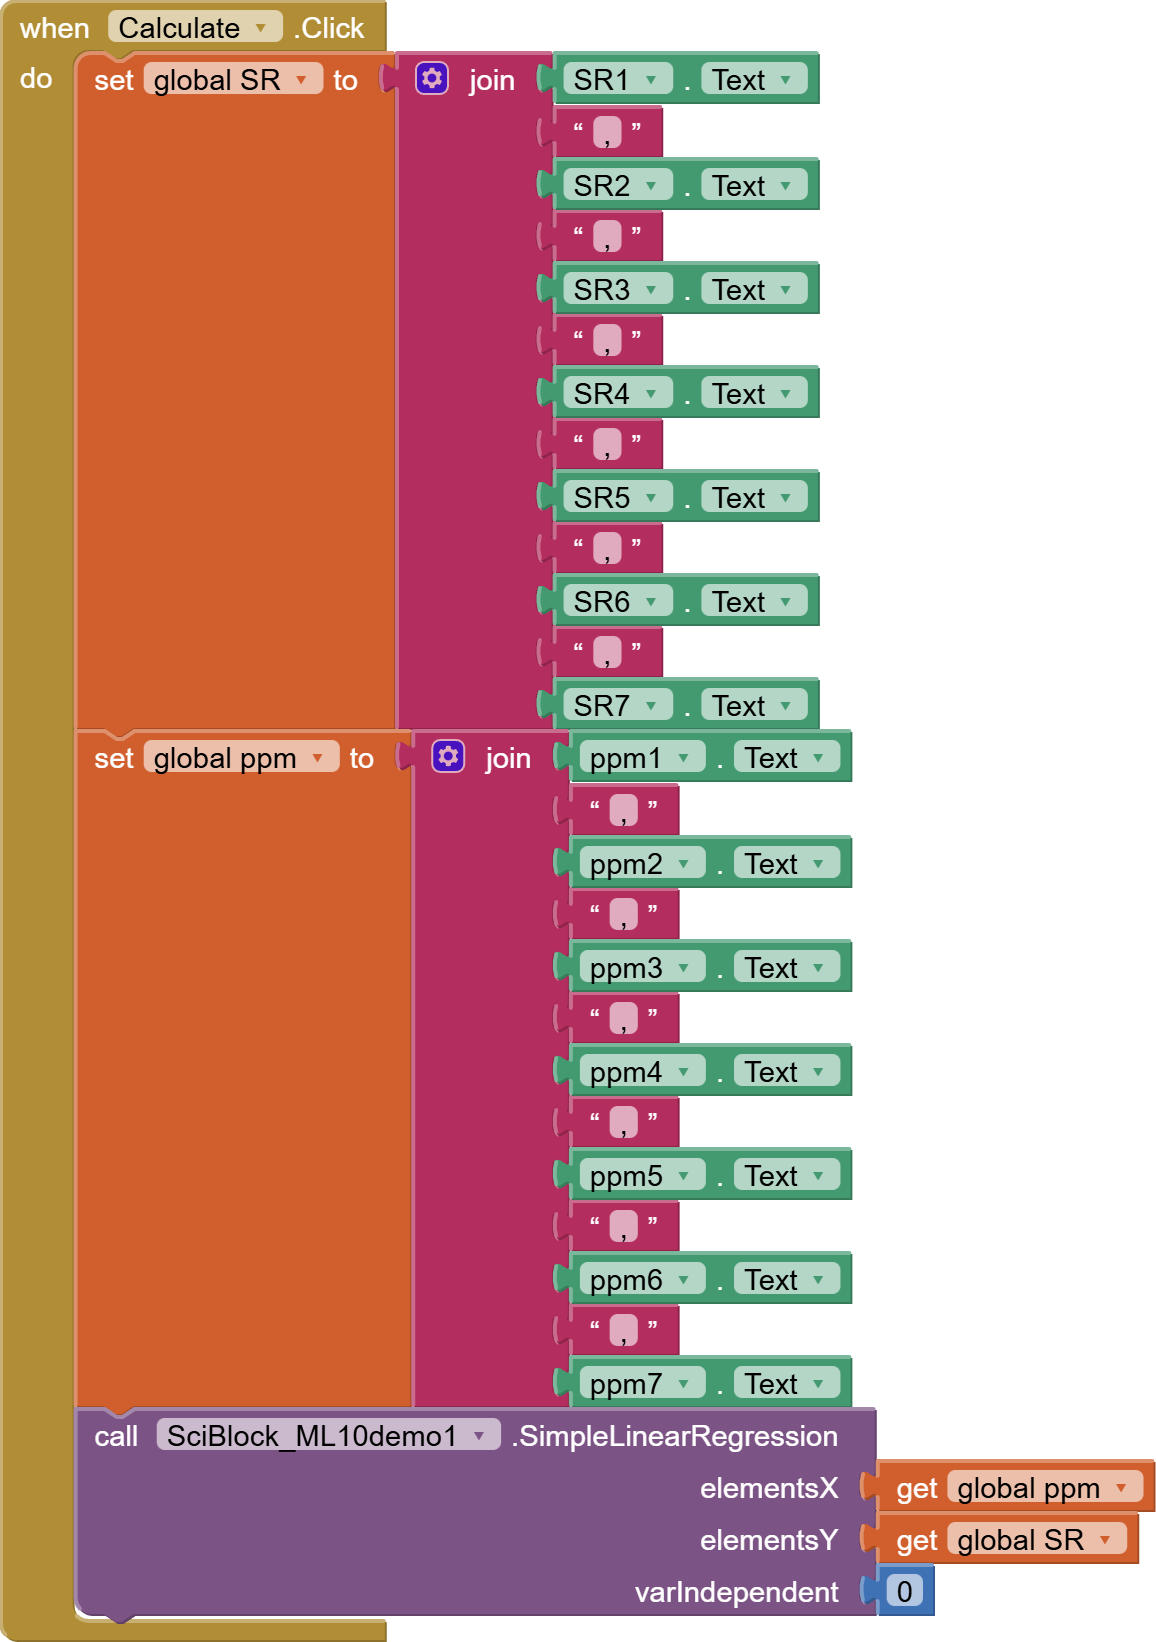
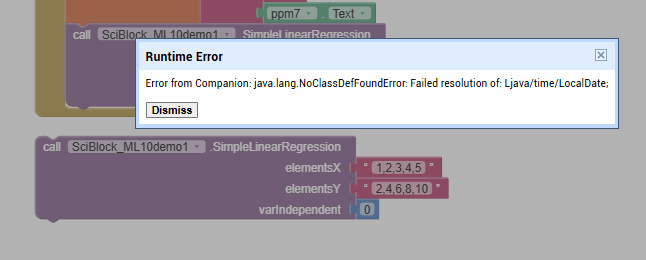
I tried your SciBlock linear regression extension in a separate Project, and it crashed on me.
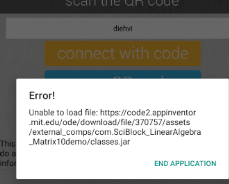
I had copied it from
https://github.com/SciBlock/extensions/raw/refs/heads/main/com.SciBlock_LinearRegression10demo.aix
I suggest using the AI2 linear regression component.
I also notice in Screen4 you are shoving all your textbox inputs into the extension, without checking to see if they are all number, and not blanks.
I tries a sample call to your .aix in Screen4, using what should have worked, and it also crashed.
The AI2 regression component looks like all you need.
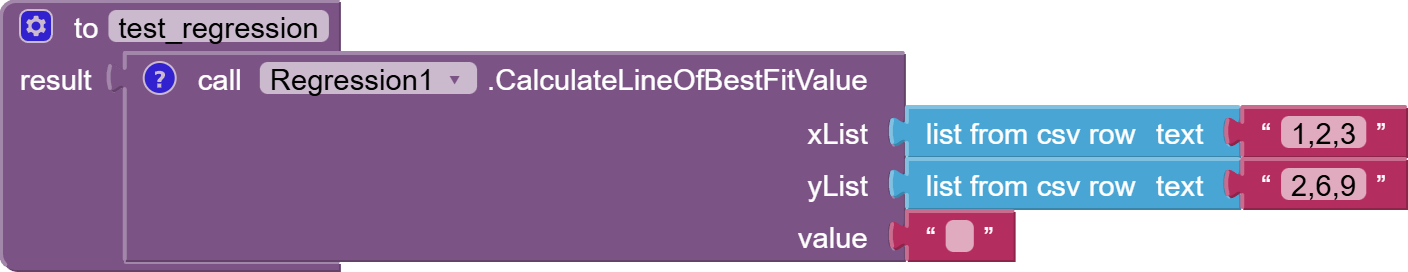
I can't go further on this without some training data for the regression model.
Tyoe some (SR,PPM) pairs into a spreadsheet, and download the CSV table here.
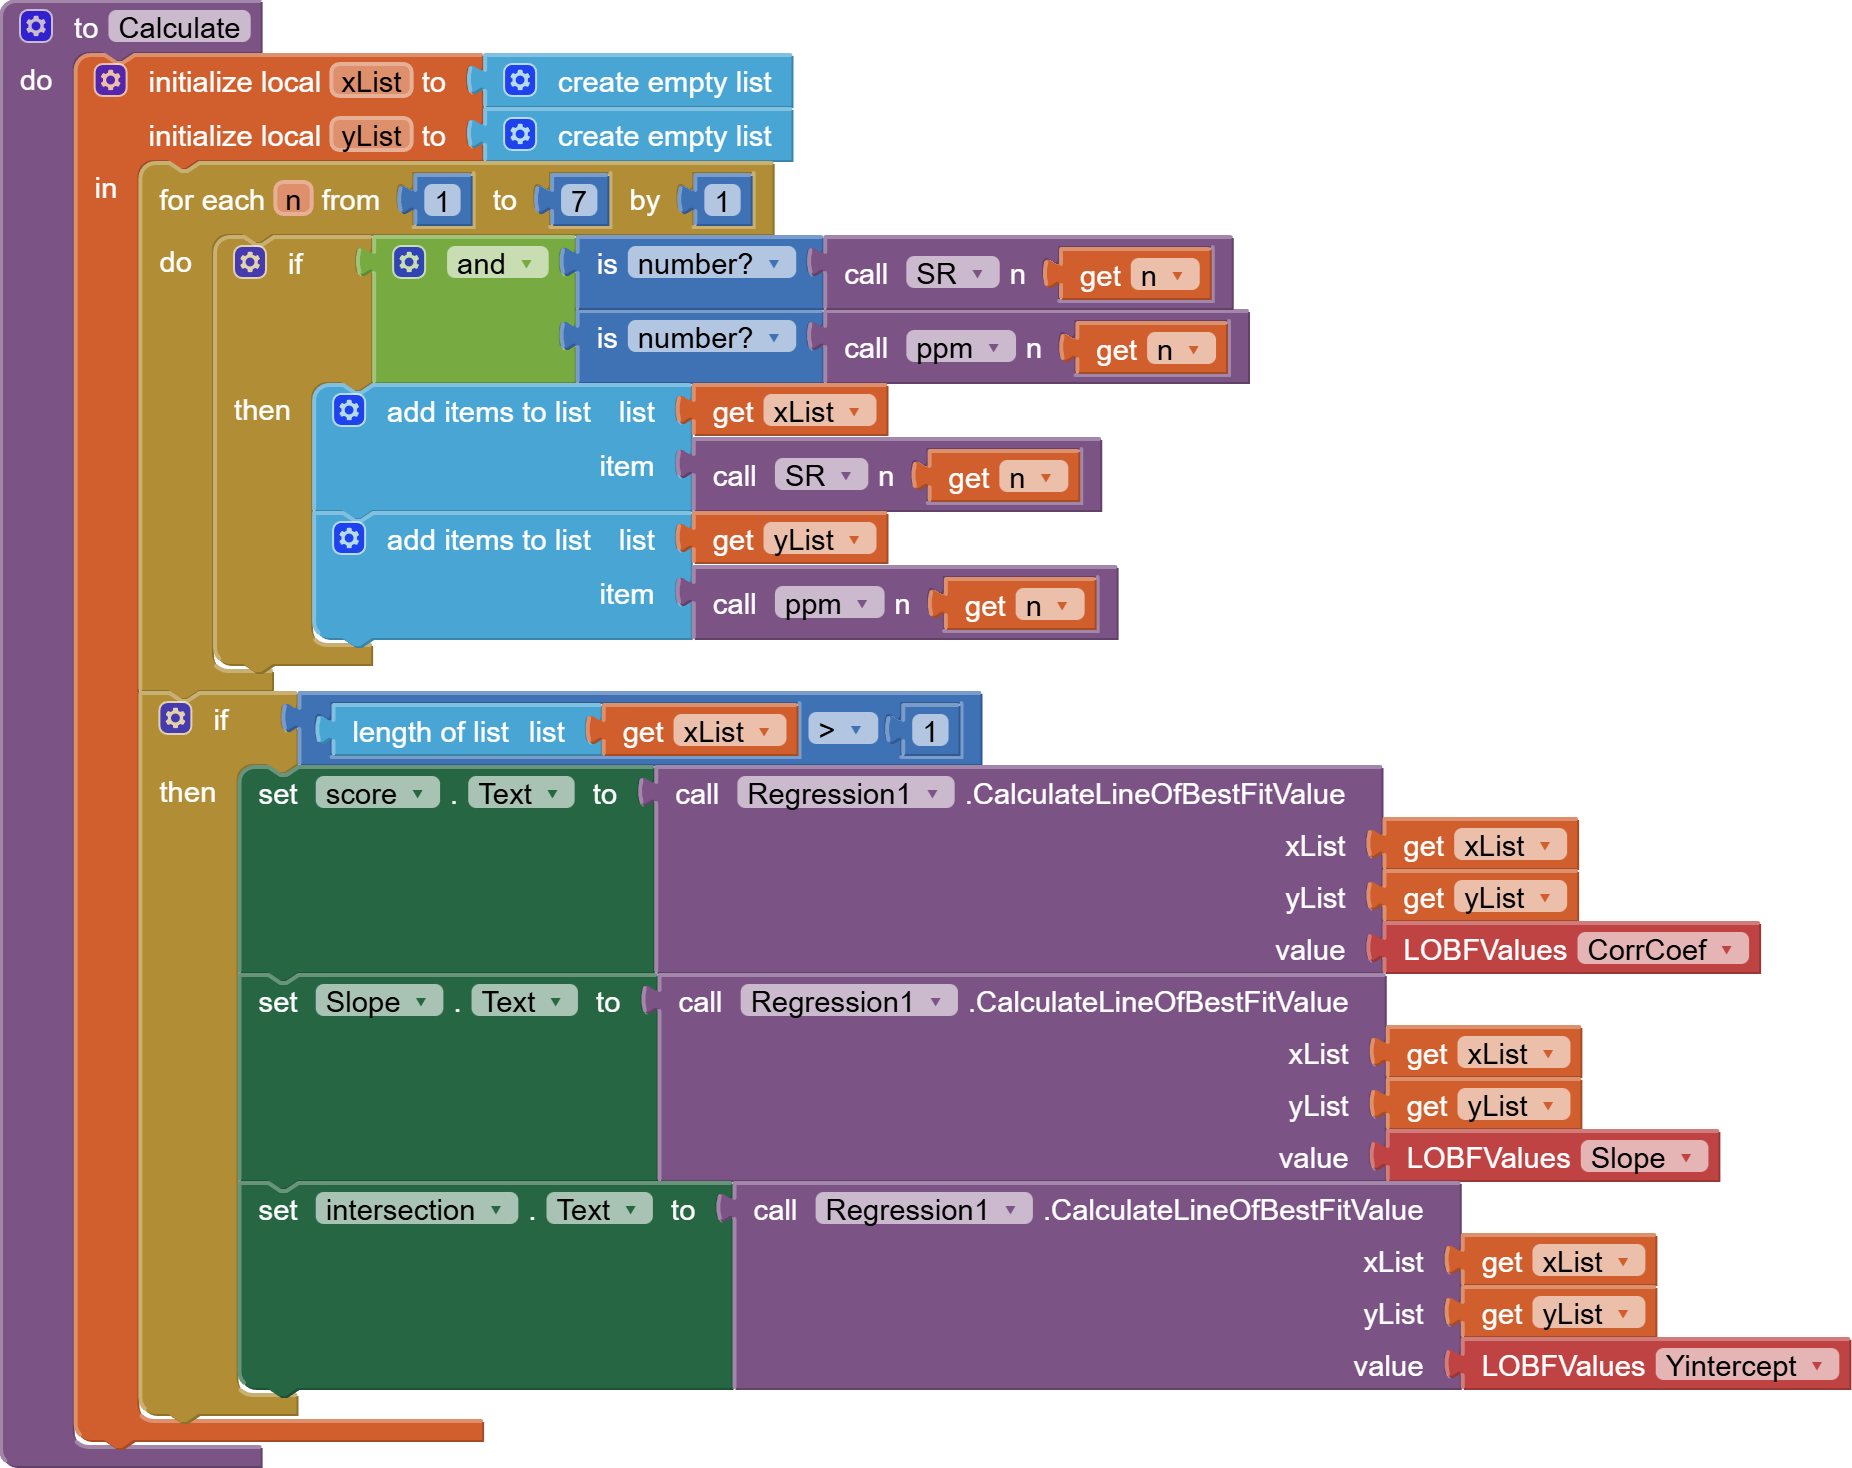
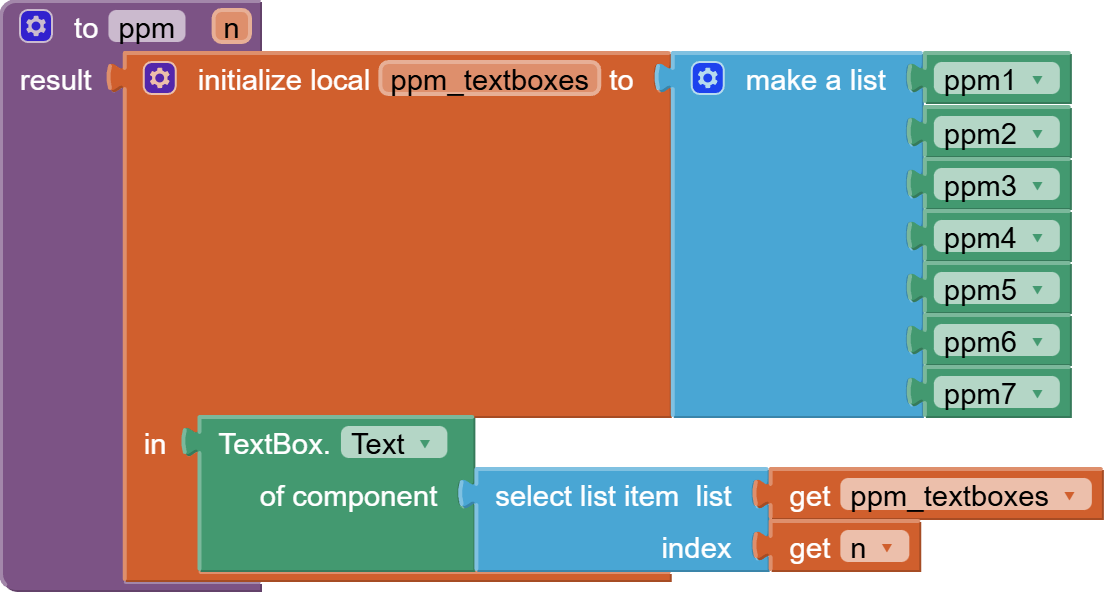
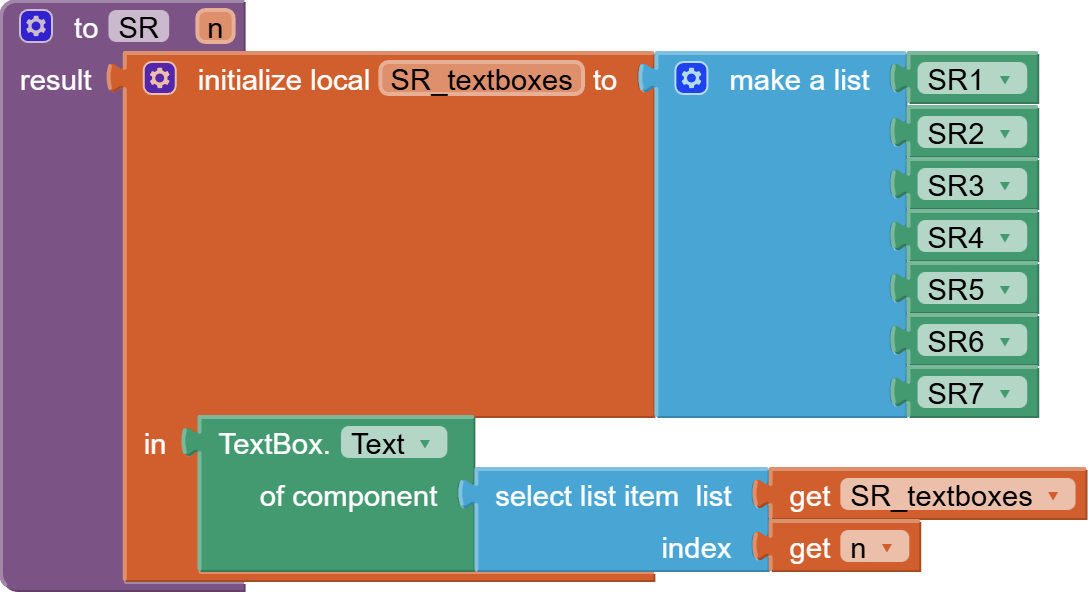
Here's a rewrite of the Screen4 Calculate operation, taking into account blank inputs:
The calculate procedure only adds valid x and y pairs to the regression inputs xList and yList.
I left out the Prediction calculation, because my high school algebra has faded, and I am not sure which is dependent on what (ppm vs SR).
BELAL2025NANOMADVERSION7_copy_copy (1).aia (333.6 KB)
Pop up a Notifier with the x and y, or drop them into Labels.