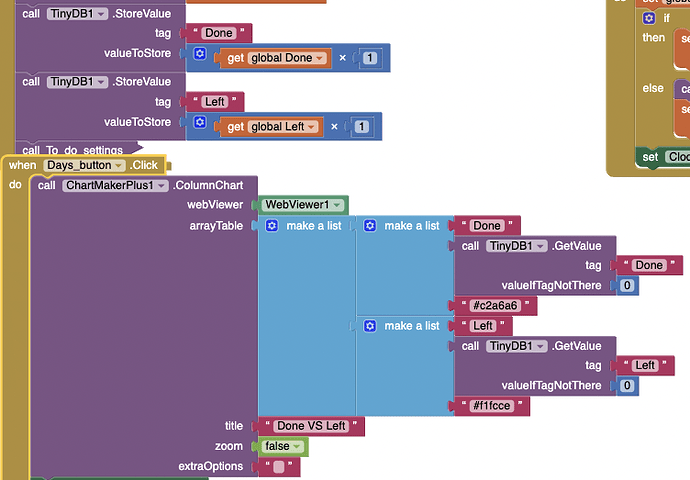
I changed the way of storing value and it works now, thank you one more time for this extension!
Good to here you got it working 
Thanks for helping me get this working, I looked in the documentation and did not see the JSON check box mentioned perhaps that should be updated as I spent hours thinking I was an idot
As previously mentioned, I have now updated the documentation in the first post to cover the use of ShowListsAsJson
How change border color from white to custom color?
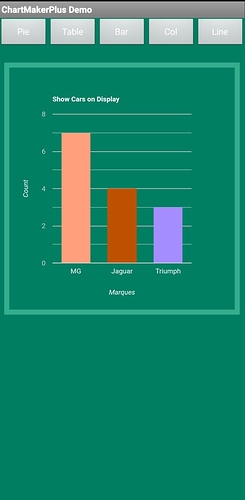
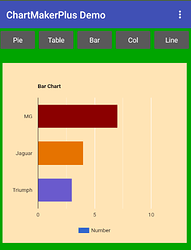
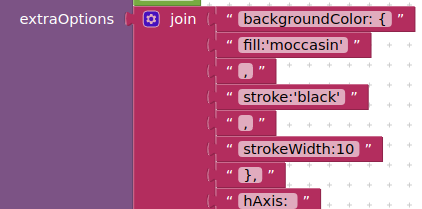
You can add a border to the chart with a custom colour in the extraOptions:
backgroundColor: {
    fill:'moccasin',
    stroke: 'black',
    strokeWidth:20
    }
but this still leaves white border which is the html background.
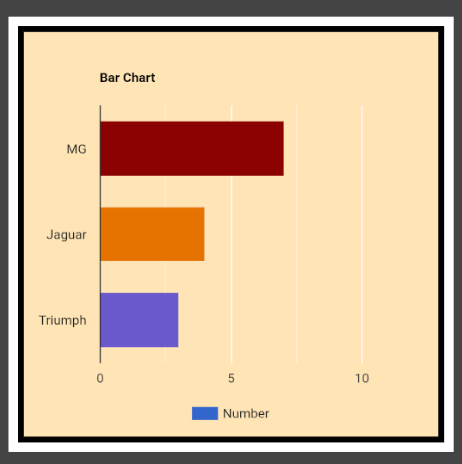
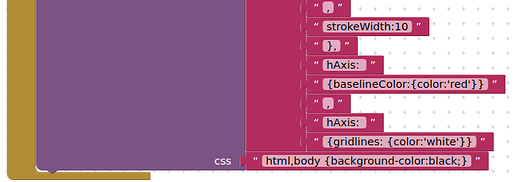
I would need to add another parameter to the chartmaker to allow the setting of the html/body background colour.
OK, that has worked up:
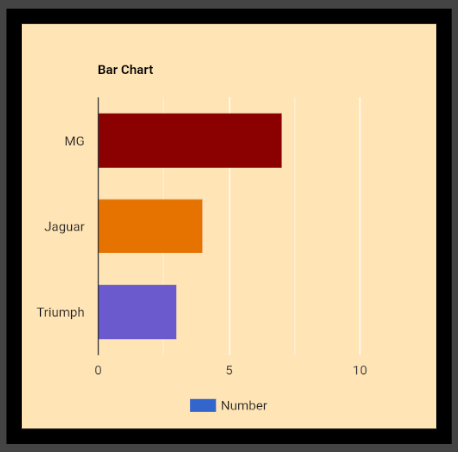
Here is the extension:
uk.co.metricrat.chartmakerplusv3k1.aix (10.0 KB)
Will just need to update the extension documentation in the first post for everyone else
Thanks for update. ![]()
![]()
Why chart is not shown and webviewer remains blank when haven't net and offline mode? ![]()
See
[quote="[Free] ChartMakerPlus - an extension to make google charts Extensions, post:81, topic:36473"]
Try other chart methods for offline
[/quote]
which one?
You will need to look into the documentation for highCharts to find out.
Sorry, I thought you had moved on to HighCharts 
The google chart is placed inside a div in the body of the html page. By default the body has a default margin of @ 10px on an html page. You need to remove this, setting the margins to 0, in the css.
body { margin:0 !important;}
(if enabled, ensure you have the background-color strokeWidth set to 0 as well)
For the chart you can set the size of the chart in the javascript, to the window of the webpage using the width: window.innerWidth and height: window.innerHeight settings - in extraOptions (you may need to adjust these ,e.g. minus 1 or 2 in order to remove the scrollbars if they appear). This second part may not work/be necessaary, because the containing div has styles of 100% for width and height hard coded, outside of the javascript.
Hi, I'm trying to use this extension, and everything seems to be alright, but it doesn't show anything when I click the button, what could be a problem? Thank you
It works, thank you
@TIMAI2 Is there a way to detect when the chart has been received from Google (presents on screen)?
Thank You
As suggested in your help topic, and here on post #70
Thanks .. I knew it had to be something I was overlooking 
