Fide_app, if your sales values really never take negative values, do you have this extraOption ?
curveType:'function'
Remove this extraOption and give feedback...
Fide_app, if your sales values really never take negative values, do you have this extraOption ?
curveType:'function'
Remove this extraOption and give feedback...
@TIMAI2 I have a little suggestion for you. Is it possible to add an block After ChartMakerPlus1.ChartGenerated as it takes some time to generate the chart.
I will add it to my list of things to do.
Thanks 
I removed the curve but still it shows negative values.
mmm, no more ideas, take a look at TIMAI2 suggestion of read:
https://developers.google.com/chart/interactive/docs/gallery/linechart#configuration-options
Maybe a vAxis.scaleType true or vAxis: { logscale: true } in extraoptions can help you if the Log scale is fine for your lines chart
Also see here:
It worked , used vAxis: {viewWindow: {min: 0}} string 
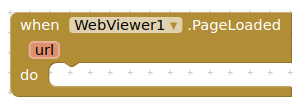
You can use the webviewer's PageLoaded event for this.
I'll definitely try this. Thank you
extension updated today to provide for file access in Kodular....
How can I use the graph without internet?. Now, a data connection is required to show datas.
Any reason why this will not work in another app. The sample app works but when I directly copy the content to another app through my backpack it no longer works, I have tried the table chart and the line chart. In both cases I just get a white web view box after clicking the button
Do you load the extension as well?
Please share your aia project
Ultimately there is more to the app than the chart but I am just trying to get the chart piece working, yes I have loaded the chartmakerplus extension and added it in design view. In the block view I have collapsed everything that does not have to do with the chart view before creating the AIA that I have uploaded below.
UCONN4_20mA (1).aia (504.3 KB)
You have ShowlistsAsJson unticked in Screen1 properties (designer). If you tick this box the table chart will appear.
ChartMakerPlus relies on json arrays (lists with square brackets) to send to Google Charts. This (ShowListsAsJson) is ticked by default, but I have added this requirement to the description up top.
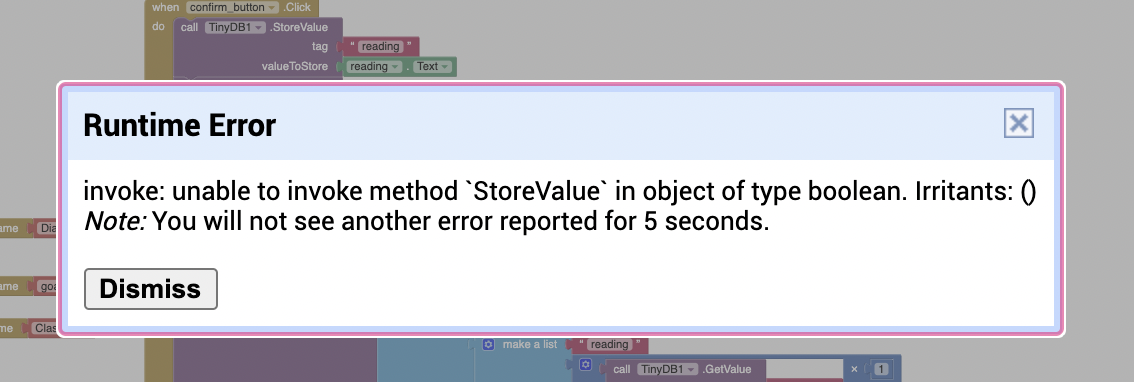
Hi, that's a great extension and I really love it, but I have met some problem. I don't see any mistake in blocks, however it shows me this error. Thank you for your time
Your error appears to be related to your tinydb store value not the chartmaker.
Also are you running the iOS companion ?
I tried both android phone and iOS companion, no result. And the value stored in tinydb is a number, so I'm really confused how to make charts with users input