HC-05 and HC-06 here
1 Like
Great job Juan Antonio !!! 


To do the same I was using a canvas split in two sections (a left one , mirroring the right one) but the effect was not continuous like yours (i.e. such as a scrolling track on an oscilloscope). Thanks a lot: this will be a big improvement in my "digital HUD" for my old convertible.
Cheers, Ugo.
1 Like
(added to FAQ)
Amazing job @Juan_Antonio!
I have implemented similar moving real-time graphs using the timers and recursive draw functions, but this extension would make the process so easier!
5.- Screen1 to connect. Screen2 to view data.
p299H_GraficoDinamico_5.aia (12.6 KB)
 The application must be installed
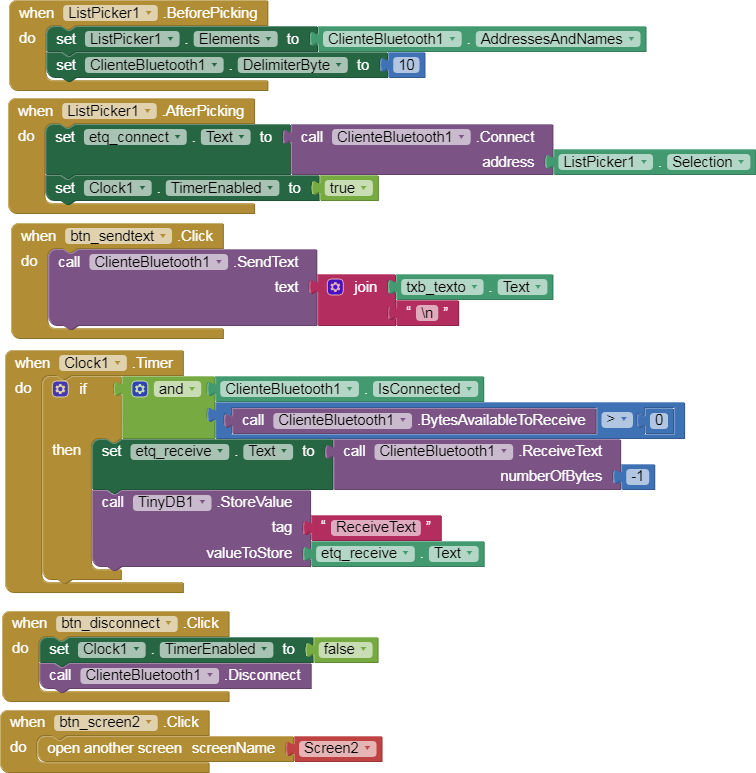
- Screen1 to select and connect Bluetooth.
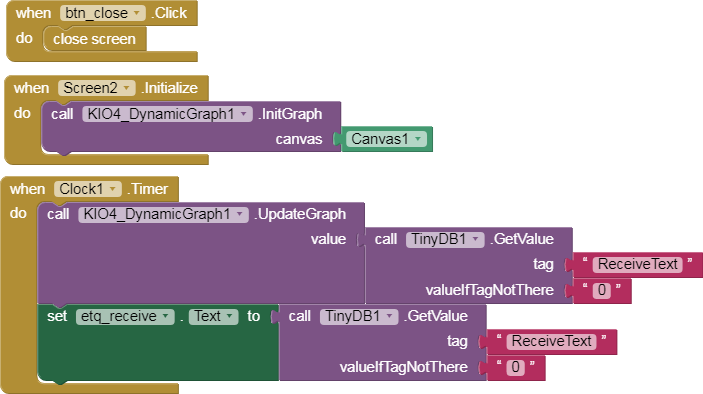
- Screen2 to view data graphic with an extension.
- We can go from one Screen to another without losing the connection.
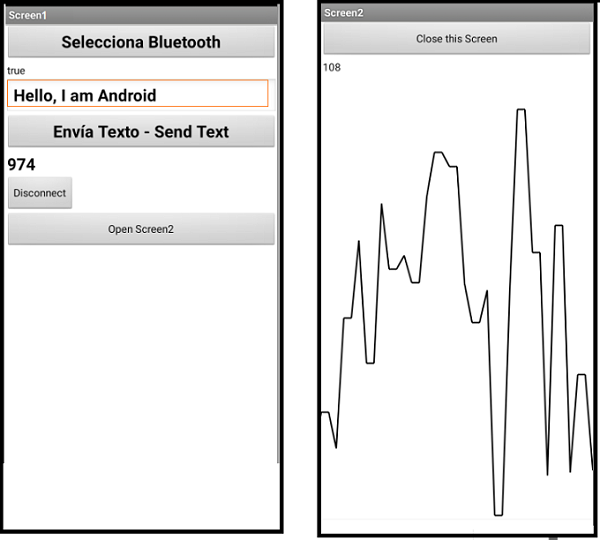
Screen1.
Screen2.

// Juan A. Villalpando
// http://kio4.com/appinventor/299H_extension_GraficoDinamico.htm

#include <SoftwareSerial.h>
SoftwareSerial BT(2,3);

String texto = "";

void setup(){
 BT.begin(9600);
 Serial.begin(9600);
}

void loop(){
  // Send random every 800 ms.
  delay(800);
  texto = (String) random(0,1000);
  // Serial.println(texto);
  texto = texto + '\n';
  BT.write(texto.c_str());

  // If receive BT, write.
  if(BT.available()) {
    Serial.write(BT.read());
    }

  // If Serial Monitor, send data by BT
  if(Serial.available()){
    texto = Serial.readStringUntil('\n');
    texto = texto + '\n';
    BT.write(texto.c_str());}
}
- Sketch sends random every 800 ms. by BT.
- You can write a number on Serial Monitor and send it by BT.
- You can write a text in the app and send it to Arduino by BT (check Serial Monitor).
3 Likes
(added to FAQ)
Hello dear ,
I want to stop the shifting at a certain point .. how to freeze it ? Like my Arduino sensor is sending bell shape once it hits back the zero Y I want to stop it ? I see we have two options , either one screen … no shift or keep going shift left forever … how can I stop the graph as is at a certain point ? … thank you so much for your help
You can do the control on the Arduino,
(schematic code:)
if valueinArduino = 0 then sendtoapp 999999
Then in App
if ReceiveText = 999999 then Clock.Enabled=false
thank you so much .. working like a charm ! ... now i have full control of it except i am missing the following:
1- my horizontal x line can be 2 min or 2 hours ... if i need both cases to be in ONE screen .. how can i change X scale according? (before i start plotting i do not know in advance if it will be 2 min or 50 min or 2 h ..) ... can i zoom in out ? like using two fingers to change x scale ?
2- lets say case one above is not possible and my x for one screen wide of my cell is 10 staps while my graph is 30 steps ( like 3 screens wide) once graph done .. can i scroll right - left to see the whole graph in the 3 screen width?
btw i tried changing the kio4 dynamicgraph.resolution > to Slider1.thumbposition which works fine with NEW upcoming data to be plotted, not the previously plotted data.
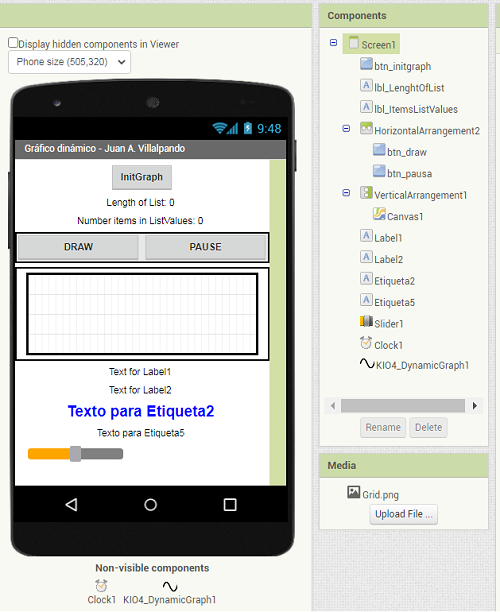
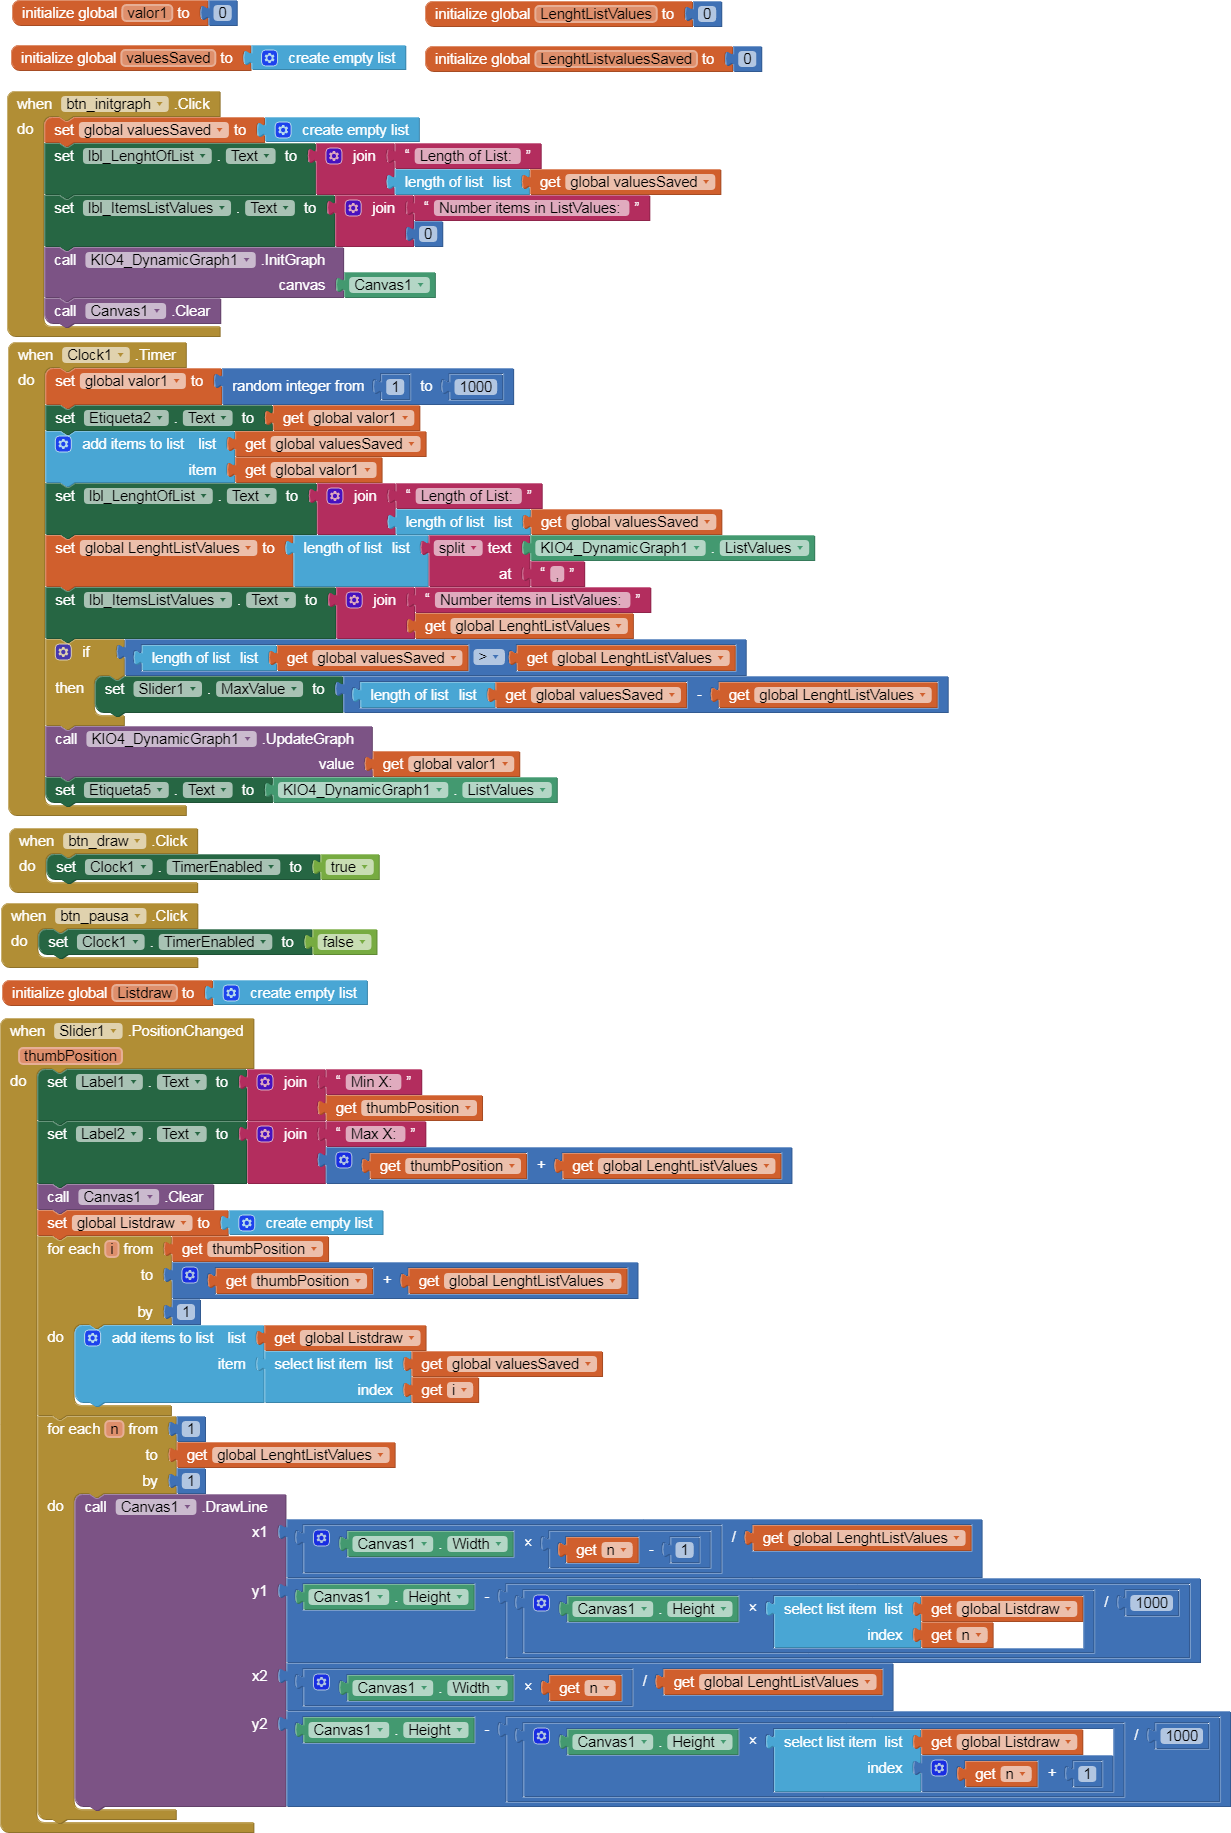
6.- Save all values in a List. Show graph with saved values.
p299Hi_GraficoDinamico_7.aia (18.4 KB)
Save all the values in a list.
Pause.
Using a Slider to display graphics on the Canvas with the saved values.
thank you
google chart means my cell must be connected to internet right ? .. i mean if i need it to plot the graph offline (i am using bleutooth to arduino) .. can i save the google js file at the arduino then that file will generate the grapf without need of uploading it to google chart live?.. possible?
thank you
OMG ! i never thought i can use google chart with off line ! .. now i can make either Bluetooth or access point and while my cell is NOT on the internet data and even draw the graph ! this is great tutorial in your link .. not sure why i never came across it ! .. maybe cuz i was searching in english while its original is Spanish (i guess ! , i asked google to translate it so i know what is that ..etc ) sorry i know 3 languages but Spanish is not one of them . have a wonderful weekend.
You can't! Juan's guide uses chart.js which works in a similar way, but allows you to download the entire javascript required (which you cannot do with google charts)
I think it works without internet connection.
I build, I install.
I disconnect the mobile from Data and Wifi.
I start the app and it works.
p169Di_javascript__graficos_2.aia (113.6 KB)
@jgh_jkhg
BTW:
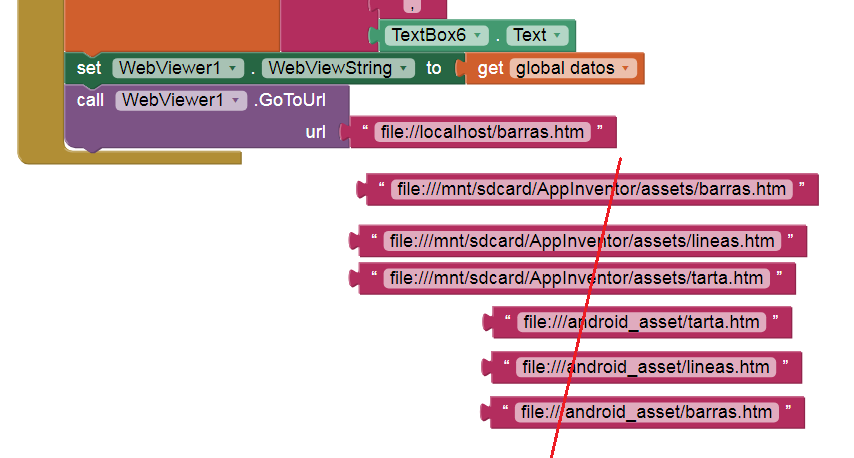
Change this to...
file://localhost/barras.htm
1 Like
guess what .. works like a charm .. i did loadcell scale (hx711) but with variable load up and down ,... i have a nice graph now. ..
- i do not know if i can now use it online! i know i can conne app inv 2 via bluetooth or esp32 as access point .. but can i connect via internet (i have no static ip home nor ddns ) .. like blynk or remotexy both can connect online via internet/cloud .. can i through app inv ?
be blessed
- if answer is NO i can't .. then should i upload app inv2 to tinyDB cloud or firebase ? then ask esp32 to access it ? possible ? .. just concerned about data security .. etc (is it possible direct connection between app in and arduino remotely via internet ?)
Find information about Firebase, MQTT,... in this Community.
1 Like
Juan, such prompt VOLUNTARY help and straight forward to the point is a remarkable grace from you .. thank you so much Juan
thanks for clarification TIM
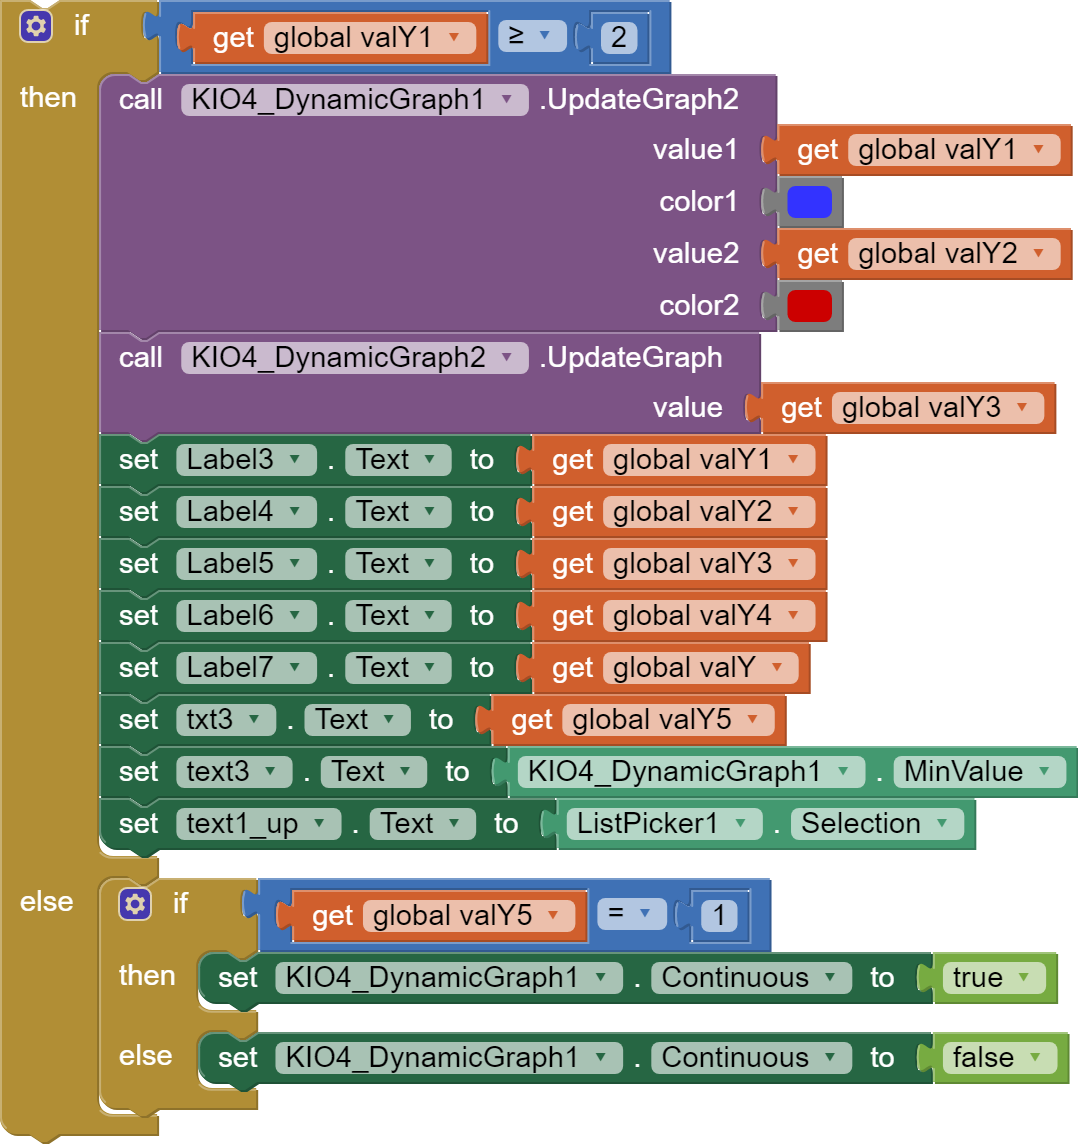
hello Awesome man,
i have three values to draw .. so i used {{call kio4dynamicgraph1. updategraph2}} .. two values are plotted fine .. then on same page i added {{call kio4dynamicgraph1. updategraph}} and i added the 3rd value there (using same block ) .. but i get nothing ! .. would you please shed me some light here.. thank you so much