In another category (PU) @ABG showed us some code to shift a graph to the left with the Chart component.
Here is a version of the code.
borrar_charts.aia (3.5 KB)
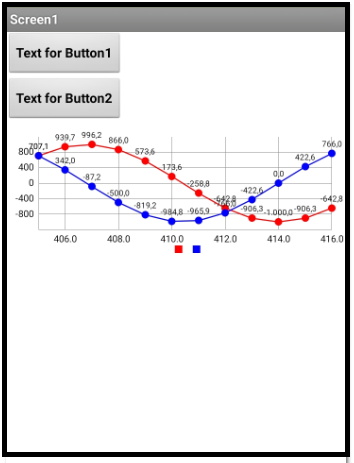


Thank you @ABG
In another category (PU) @ABG showed us some code to shift a graph to the left with the Chart component.
Here is a version of the code.
borrar_charts.aia (3.5 KB)
Thank you @ABG
hi, i love to see this beatiful charts. do you have any video for explaination on this ?
What would be the benefit of a video? The blocks are there to be used. Making a video takes a lot of time.
I dont have the calldata Block??
What calldata block? There is not one in the aia example
Did you mean the ChartData blocks?
You pull them in from the Designer as part of the Chart.
That will make their blocks available in the Blocks Editor.
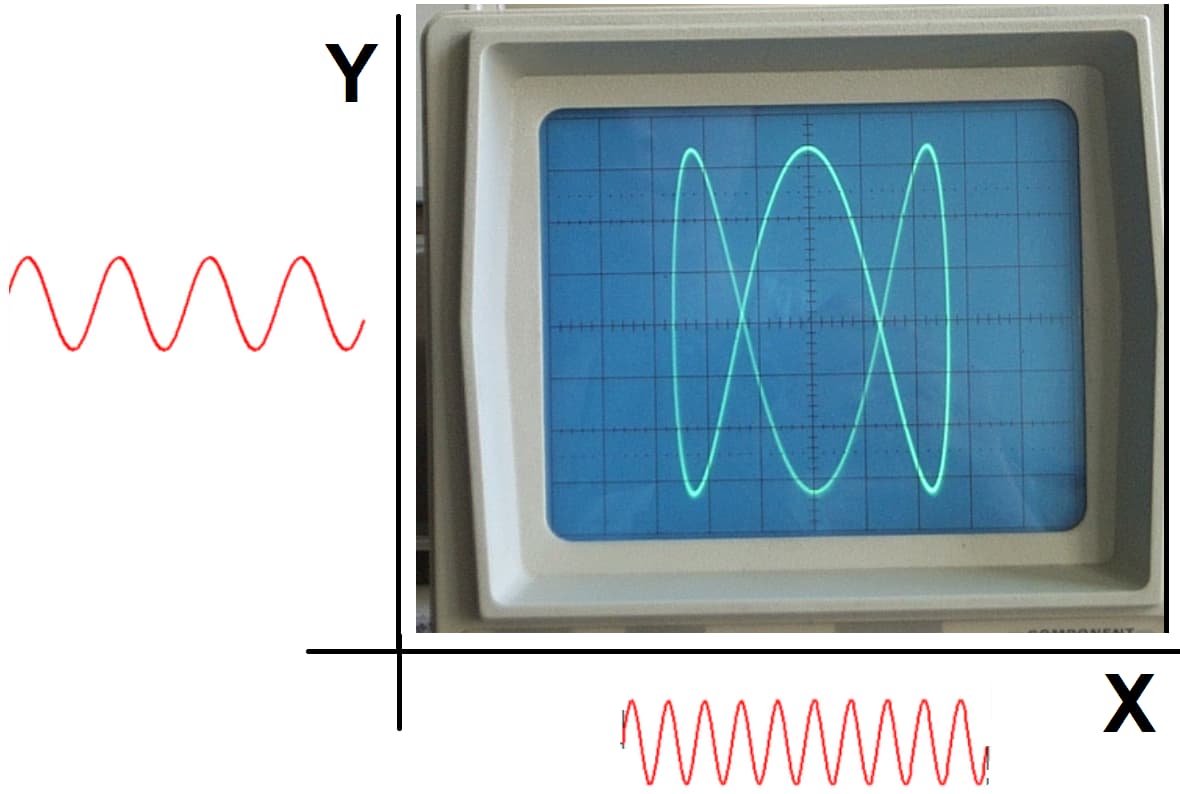
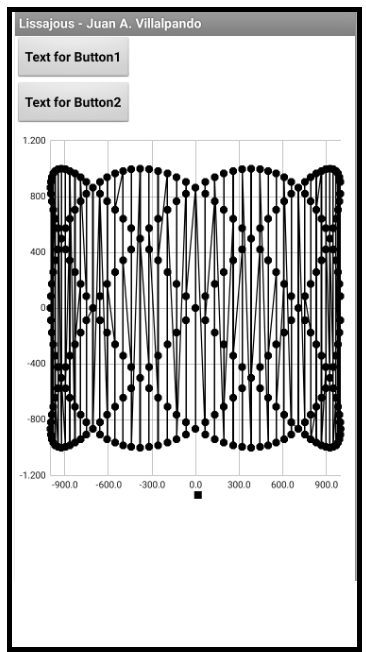
2.- Lissajous figures. Oscilloscope.
Lissajous figures are used in electronics, in the study of the oscilloscope.
A sinusoidal signal is introduced through channel X and another sinusoidal signal of different frequency through channel Y, the union of these two signals produces the Lissajous figures.
Depending on the frequency ratio a figure will be obtained.
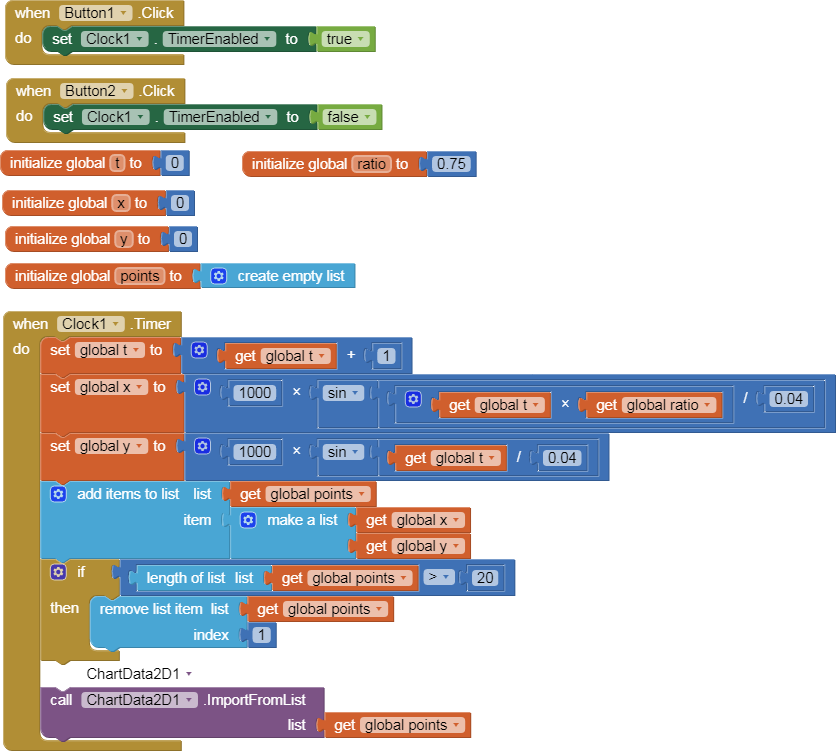
p201_lissajous.aia (3.1 KB)
- Change ratio.
Hi
Very good extension but how to manage time on the x-axis?
thx