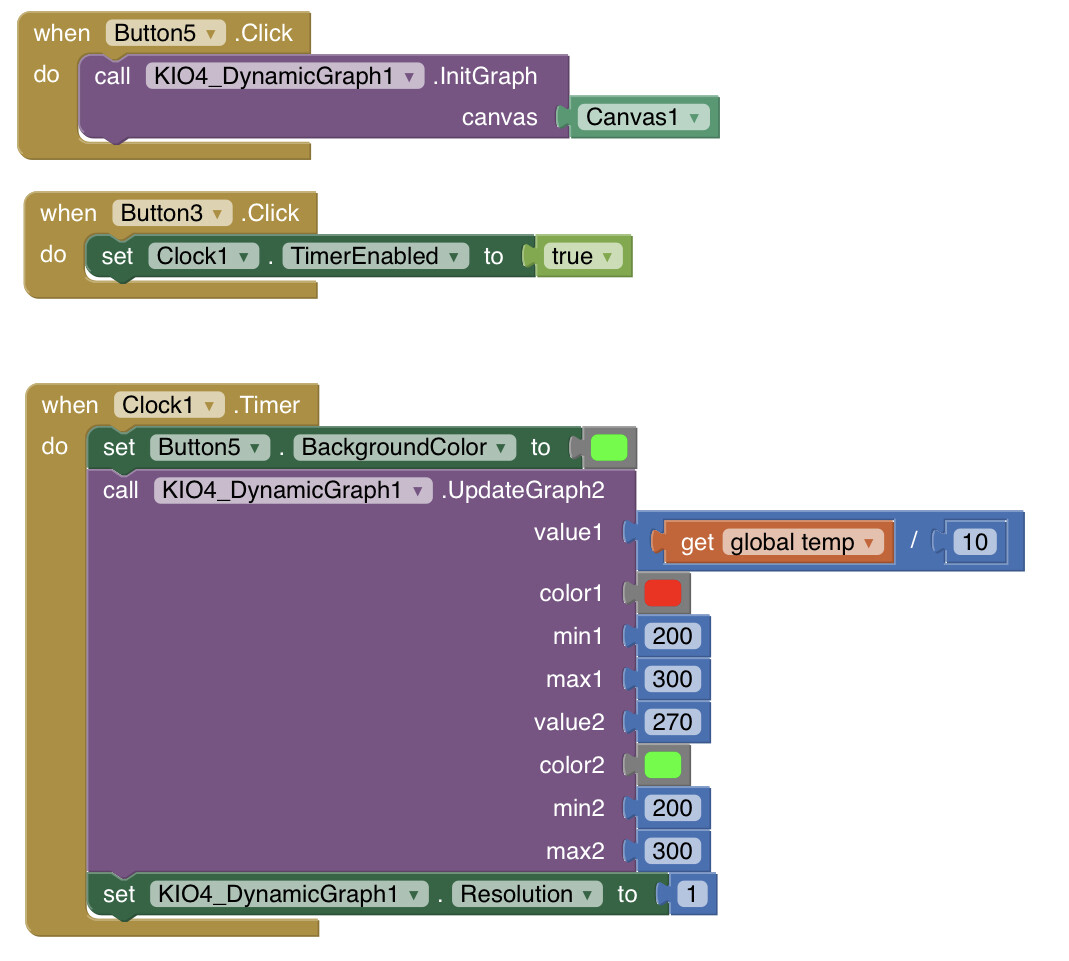
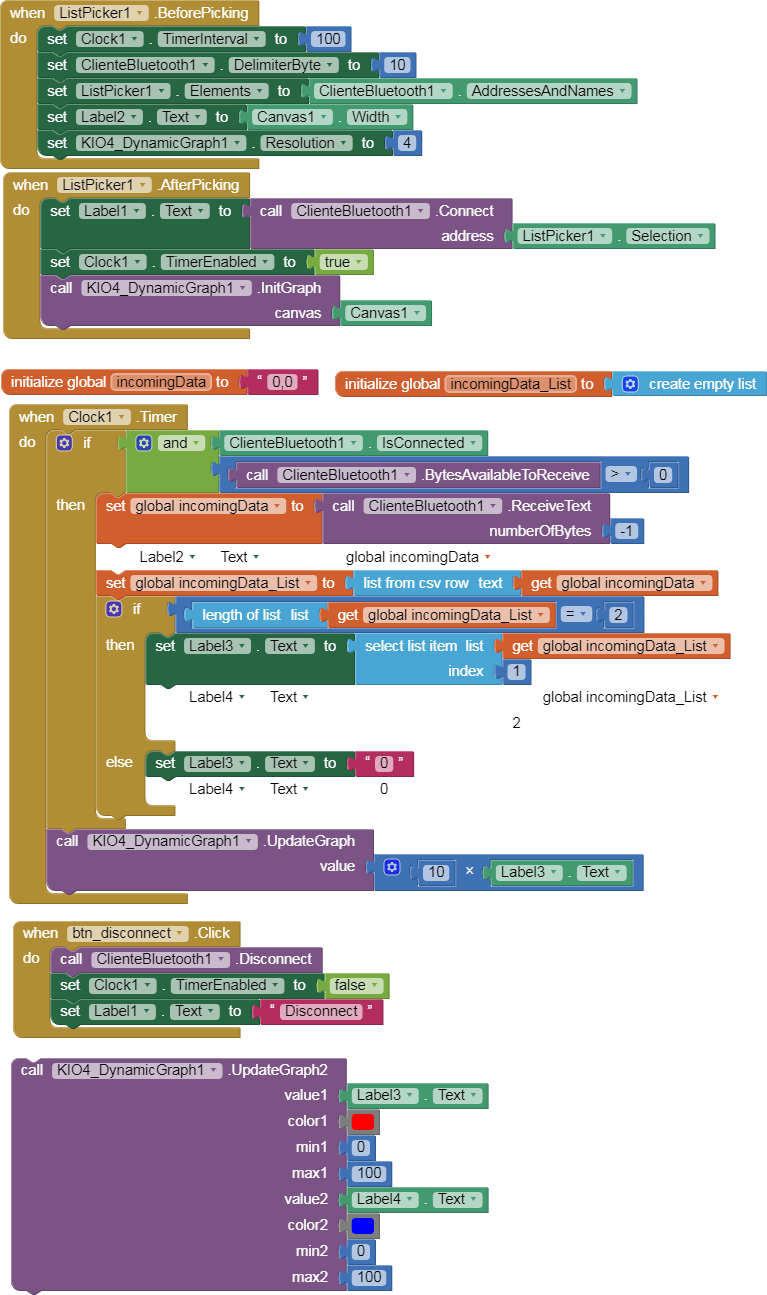
I have added the block with two graphics.
http://kio4.com/appinventor/299H_extension_GraficoDinamico.htm
you are as awesome as usual ..
fyi , no lagging or cutting and pausing in my graph anymore with 2 var extension. be blessed 
your HELP is needed please.
- to freeze the graph >> you said disable the clock .. ok ,, but to resume the graph again with diabled clock ! .. ? .. so would you please add a new control as KIO4_DynamicGraph1.PAUSE=true/false ..etc.
- i need the clock to keep running all the time for other processes to keep running .. only graph need to be stopped while clock always running .. are you able please?
thank you so much ..
Set another Clock.
Hi, this is brilliant, but is there any way to plot the values of multiple potentiometers using Bluetooth?
That's very helpful thank you! I also have another question. I was hoping to find the peak value of the graph drawn, however, the get max value block seems to only print the upper range of the graph and not the peak of the graph produced. Is there a way to get the peak value? Thank you
If you want to get the maximum value returned, you should create a code for it. The MaxValue block displays the maximum value configured on the chart.
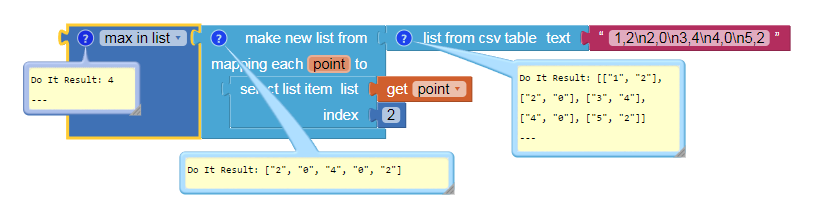
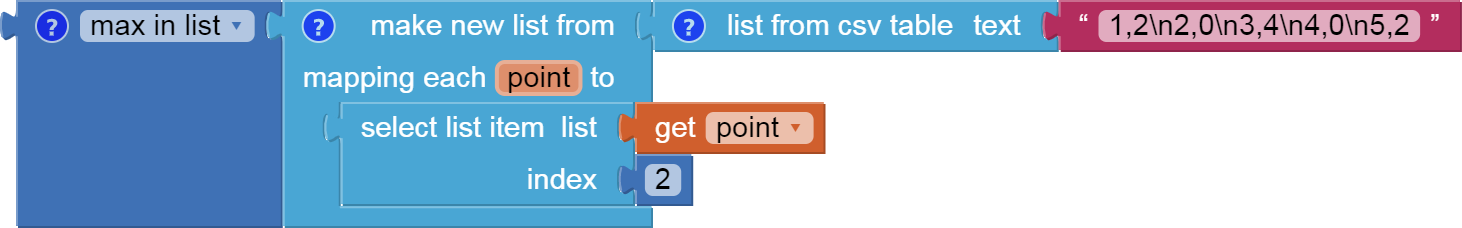
Here's how to capture max(y values) from a list of (x,y) pairs.
If you only save y values, just use the max in list block.
Hi,
Thank you for replying. This looks like its an imported list however, and its picking out the larges value from pairs of values. I think I'm looking for something more dynamic as I am streaming in data. I wanted to compare the max value to the incoming value, so if the max value is smaller than the incoming streamed value then it would update to the new value, but if it is less, it would remain at the maximum value.
I was using the if/then blocks and managed to get the max value to update with the streamed in data, but I'm having trouble keeping the max value the same if the stream data is less than the max value (the max value increases and decreases with the streamed values).
Thank you
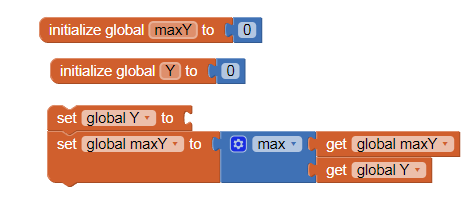
Say you want the running maximum of global Y.
Init a global maxY to hold it, initially some low number like 0.
Each time a new Y value arrives, set maxY to max(Y,maxY).
1 Like
Worked like a charm, thank you
Hi,
Great Extension
Is it possible to add legend and value on the x-axis and on the y-axis ?
Thx
If it is a static graph you can modify the background image with values in the X and Y axes.
If it is a dynamic image you must add a code so that the values scroll horizontally like a marquee, but the code gets complicated.
You can also use the Charts component:
I set the interval timer to 4ms so 1s I will display 250 bytes, How can set the x axis to display 2500 bytes (10 seconds). Thank you very much!
What a coincidence, I just started Batman Arkham Asylum.
4 Ms is a pipe dream in AI2, you will be lucky to keep up at 20 Ms
Use a list type Chartdata subcomponent and clip item 1 whenever its list length won't fit.
P.S Give my regards to Harley Quinn
4 ms is too fast, try with a basic app modifying delay, interval and resolution values.
pA0_Bluetooth_Arduino_envia_Grafico.aia (16.9 KB)
float a = 0.0;
float b = 50.0;
String a_b;

void setup() {
  Serial.begin(9600);
}

void loop() {
  a = a + 1.0;
  b = b + 1.0;
  if (a >= 100){a = 0;};
  if (b >= 80){b = 50;};

  a_b = String(a, 1) + "," + String(b, 1);
  Serial.println(a_b);
  delay(4);
}
Try
Could you modify your app for Arduino nano33 IOT?
I don't have an Ardunio Nano 33, to do tests.
In this Community there is information about this type of Arduino.
https://community.appinventor.mit.edu/search?q=Arduino%20nano%2033
I think the best option is that you learn to send random numbers from Arduino to the application, and observe those numbers in a Label, when you get it you can use the Chart component or the extension to display it graphically.
Remember that you must set Bluetooth permissions in the new Android.
1 Like
Hola Juan, ¡muchas gracias por tu trabajo!
I am working in a graph generated by data from a temperature sensor via BLE.
I would like to have historical data of around 4min shown. I have tried lowering the resolution to 1, setting the clock to 500 milliseconds (rate I am interested in). With this configuration, the graph doesn’t fill the width of the screen (even if canvas width is set to fill parent).
I have tried to increase the width of the graph to 4000 pixels and it works in one phone but in another not.
How would you recommend to increase the historical data?