In another topic we saw how we can obtain a Lissajous figure with the Charts component.
2.- Lissajous figures. Oscilloscope.
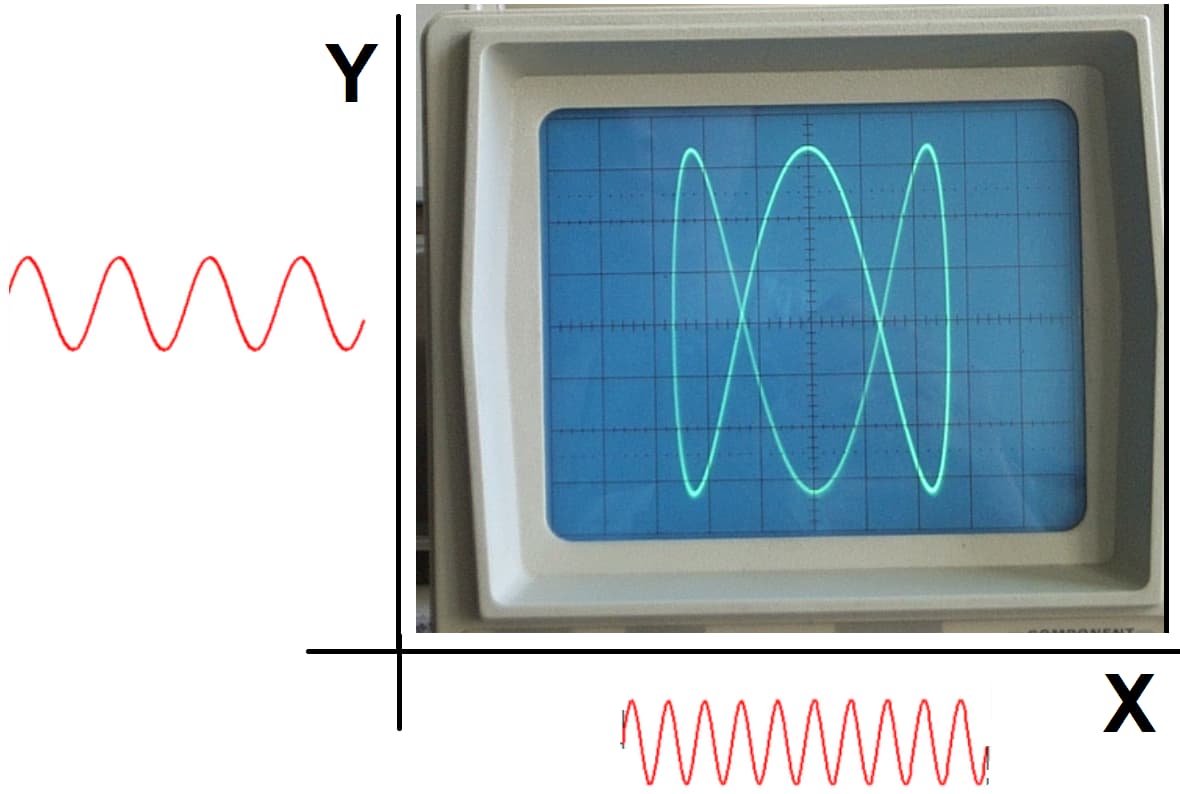
Lissajous figures are used in electronics, in the study of the oscilloscope.
A sinusoidal signal is introduced through channel X and another sinusoidal signal of different frequency through channel Y, the union of these two signals produces the Lissajous figures.
Depending on the frequency ratio a figure will be obtained.
[lissajous2]
Wikipedia: https://en.wikipedia.org/wiki/Lissajous_curve
Youtube: https://www.youtube.com/watch?v=t6nGiBzGLD8&l…
In that topic we saw a link to a web page with JavaScript to get Lissajous figures online.
http://kio4.com/appinventor/lissajous.htm
Now let's adapt that JavaScript code to App Inventor.
But first we are going to repeat what Lissajous figures are about.
Lissajous figures are used in electronics, in the study of the oscilloscope.
Depending on the frequency ratio a figure will be obtained.
1.- Lissajous figures with JavaScript.
p170D_Lissajous.aia (5.0 KB)
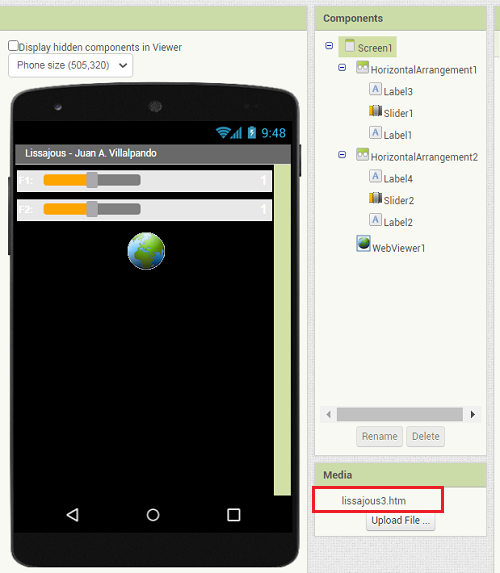
- Designer. lissajous3.htm
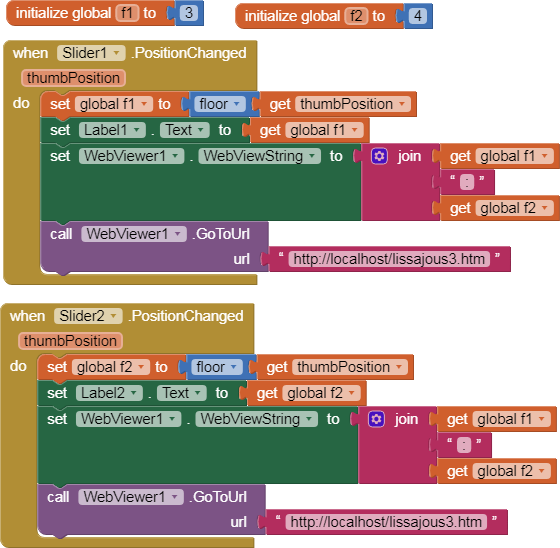
- Blocks.
2.- Use of Lissajous figures.
Through the Lissajous figures we can obtain the frequency of a sinusoidal signal knowing another pattern.
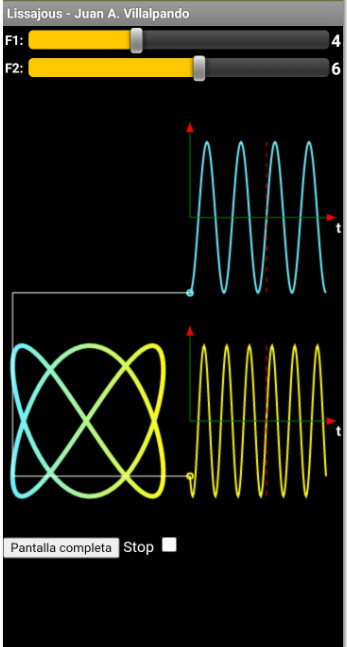
We have a sinusoidal signal of 25,000 Hz (blue signal)(pattern signal).
We introduce this signal in the oscilloscope together with another of unknown frequency (yellow)
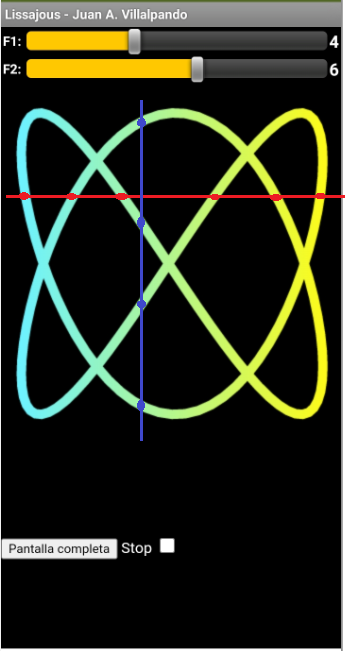
We obtain the following Lissajous figure. Calculate the frequency of the unknown signal.
- Resolution.
We draw a horizontal line that cuts the figure, we observe that it cuts it in 6 points.
We draw a vertical line that cuts the figure, we observe that it cuts it in 4 points.
That is, the ratio is 6 / 4
For which the yellow signal will have a frequency of:
25,000 * (6 / 4) = 37,500Hz
1 Like