My research work is about Big Data, so what I wanted to calculate is, apart from the percentages, who is the one who always commits the first foul of the game, for example, or who scores the points in the final minutes of the game.
...You can add another column of buttons to capture and append an 'f' to the baskets data (I'm still not here by the way).
i just shared my project. When you can look the computer you will see that I have 6 columns with ast, reb anf fouls
I understand 'fouls' - what do the others mean?
Rebounds and assists
anf?
I think it would be almost impossible for one person to record so many things during what is a fast sport.
In Estadistica, the buttons have the names of the players. This is another example of hard coding - if a player leaves the team/club, and another replaces him, you would have to modify the code. So it is better to keep the code 'neutral', e.g. player1, player2 etc
So the buttons used to record fouls etc could have their title changed when they are tapped to show number of fouls etc
I wanted to say "and"
Yeah don't worry about it. I have to present the app in december and then,if I have to make changes I will do it.
Min, TL, T2, T3?
Buttons of min means that when you touch it, it puts the time that you have entered and when you add the exit button, that it marks the time that you have left. TL are free throws, T2 are two shots and T3 are triples. I need to put the yes/no buttons in these last 3 fields.
I have said this to a lot of people with ambitious projects - draw a schematic with all your screens required and bullet-point notes about the purpose of each screen. Those notes include what needs to be flexible when the App Is run - for example the User needs to be able to add/delete players (inc images) with the App, so they shouldn't be embedded.
Since a lot of data needs to pass between screens, virtual screens will save a lot of hassle.
I'm really not here now 
Okay don't worry, when you arrive home explain me if you can how to put a virtual screen.
thank you, Richael
For this type of analysis, you would want the event timestamps to be relative to the start of the current game. That would translate the timestamps into values that could be used for sorting ascending/descending, for use in selecting first/last events of various types.
If you choose to use an SQL solution, you could go to a 6 column event table:
- game ID
- time into game
- team
- player
- event type
- points added/subtracted
How to Add a Virtual Screen ( = Vertical Arrangement)
Thanks Chris, I'll put you in muy research work hahaha.
Hi Carles
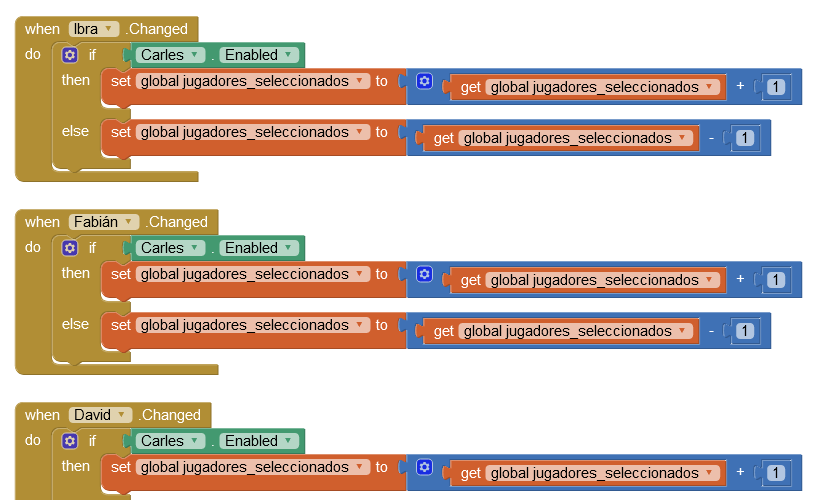
You may be wondering why these don't work:
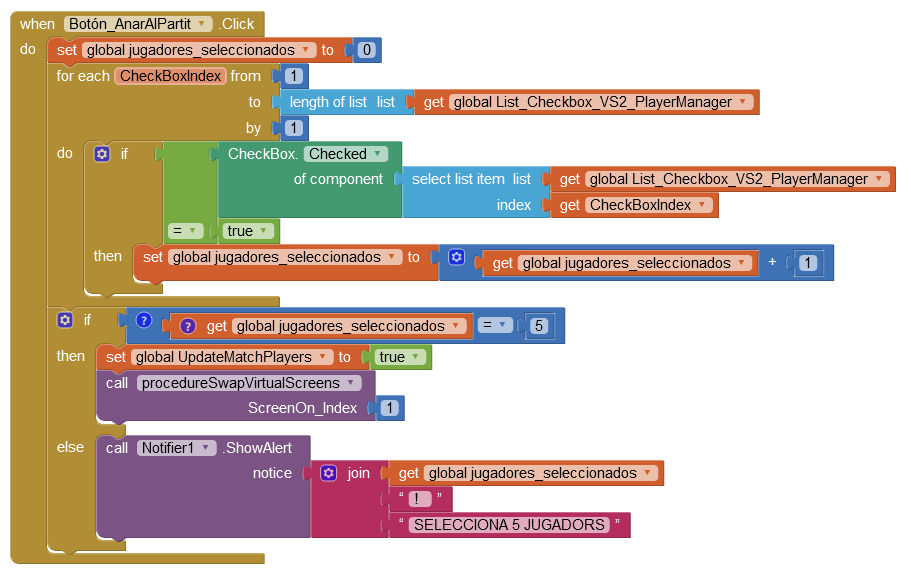
Well firstly, the test would be for 'checked', not 'enabled' but secondly the global count can go out of bounds.
So the way to do it is simply wait until the User hits the button 'AnarAlPartit' and in that Block count how many check boxes are checked:
Here is an updated example showing Virtual Screens working.
Note that the Project apparently has 3 TinyDbs. In fact, that is just for our convenience, App Inventor actually stores everything in just one TinyDb, split internally into 'Name Spaces'. It's like the UK £5 note - it's more convenient than 5 separate £1 coins.
RecordBasketsVirtual.aia (106.2 KB)
Hello Chris, that screen was a version of the project that consisted of selecting the players and clicking on the "anar al partit" button, so that the players with their respective buttons were placed on the "partit" screen, which I left aside because it I saw something impossible, although I don't know if it can be done,

