I have managed to produce a simple graph in my app using WebViewer and it works just fine. I collect only one data point per day but after 100 plus days its just a mess to look at
I am wondering if there is a way to spread out the points and be able to scroll through them?
TIMAI2
January 15, 2024, 9:32am
2
What are you using to draw your graph?
sorry ... edu.mills.appinventor.ChartMaker.aix
TIMAI2
January 15, 2024, 11:24am
4
If you make a Google chart directly, you can set the width.
ABG
January 15, 2024, 2:31pm
5
Look near the bottom of the List Blocks pallette.
There is a block that lets you extract a segment of a list, one end open and the other end closed.
You can use that as a sliding window to feed just a part of your data to whatever chart component you use.
There are also filter blocks, where you can choose your own criterion for extracting a new list from your upstream data, like every tenth point.
1 Like
Make the container of the chart wider than the screen?
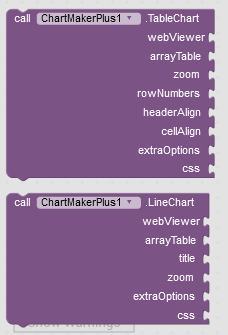
Are you meaning one of these?
ABG
January 15, 2024, 11:54pm
8
No, this one:
TIMAI2
January 16, 2024, 12:21am
9
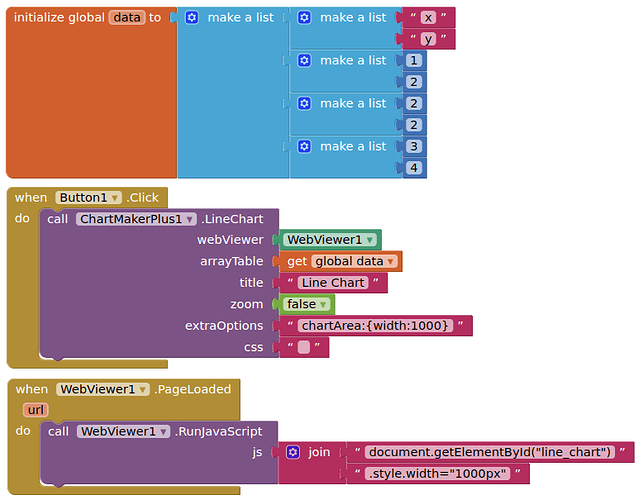
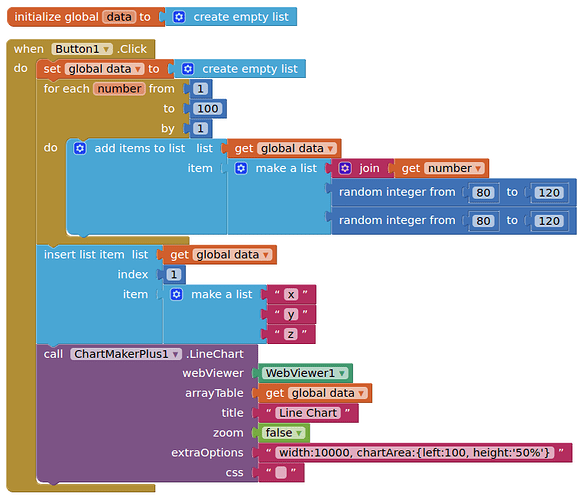
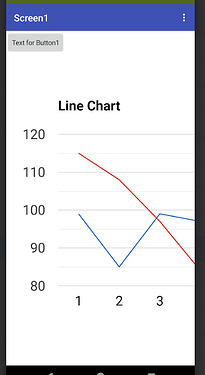
With ChartMakerPlus try this:
using your bigger dataset, adjust your width values accordingly
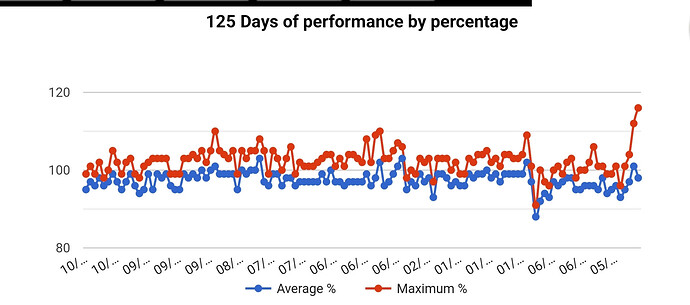
Ok this is the graph I have:
125 points is impossible to read. I collect 1 point per day approximately
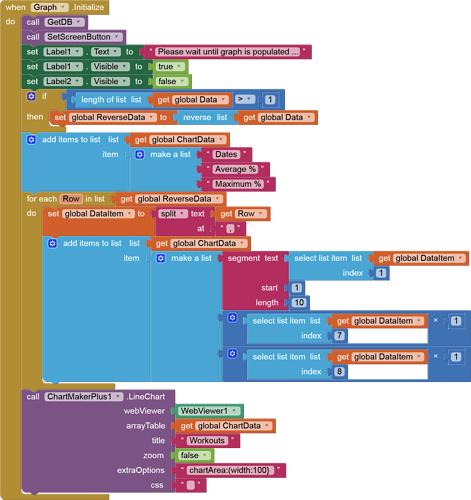
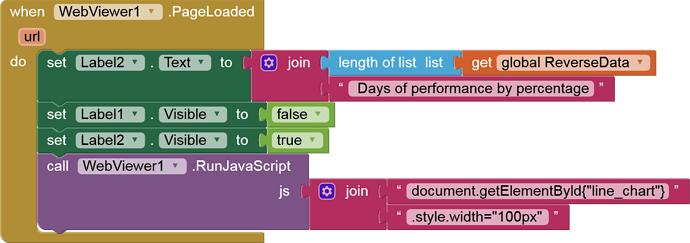
I did this:
I had 1000 px which changed nothing so I tried 100 and still nothing
TIMAI2
January 16, 2024, 9:04am
11
Impossible to see from your blocks image as to what settings you have..
yes sorry .. I am editing it
it appears I need to update my png editor
You can set Webviewer's width as 2 x screen1. Width
thanks @Kevinkun but I am wanting to be able to scroll and see up to 1,000 points
you can add 2 buttons, like LEFT and RIGHT
first show points from 1 to 50(?),
same to left button.
You can use the SLICE LIST as @ABG mentioned.
good point. Seems simple and efficient
TIMAI2
January 16, 2024, 1:10pm
17
Figured it out with ChartMakerPlus:
You will need to adjust the value of width, left and height accordingly
@Kevinkun @TIMAI2 @ABG
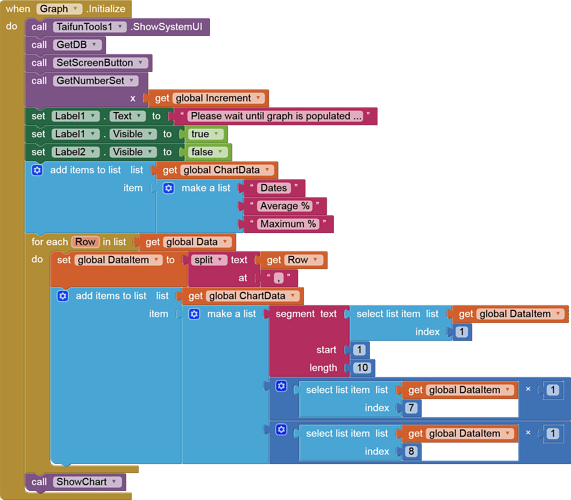
I am attempting to show 20 points of data at a time.
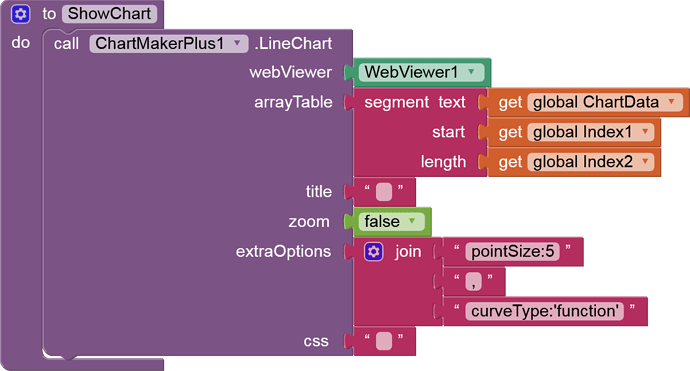
I cannot get it to display. This is what I have
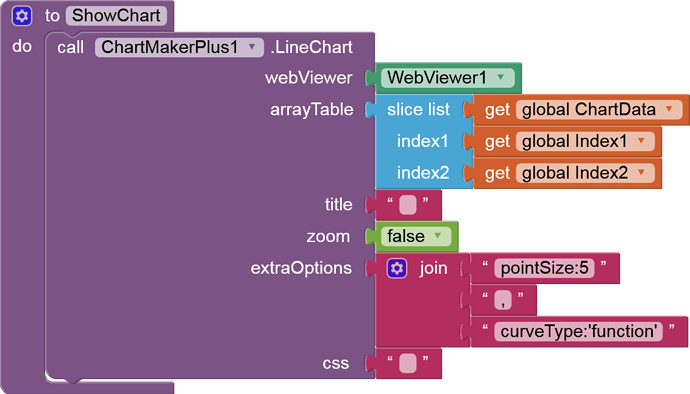
Use 'Segment ' block on a list? Try use 'Slice ' block from list drawer.
Doesn't work at all. As in blank screen
