You have decided against scrolling the entire dataset, as in my example above ?
No Tim. To be honest I don't know how to implement it. I am just trying out whichever method as best I can.
I really don't understand the chartmaker. If your method is better I will do that. Is it possible you could show me using the blocks I have shown here?
Thanks...
Hmm seems too simple. I am a bit burnt out from all the long hours of programming. I suddenly realized I only have to change the ShowChart same time you sent this message.
It's 20:00 rest time here. Will implement it in the morning
OK I could not resist. WORKS GREAT!
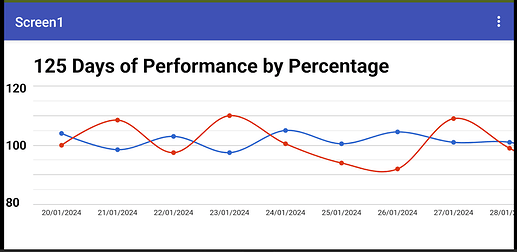
One problem: the dates are not on the graph along the bottom
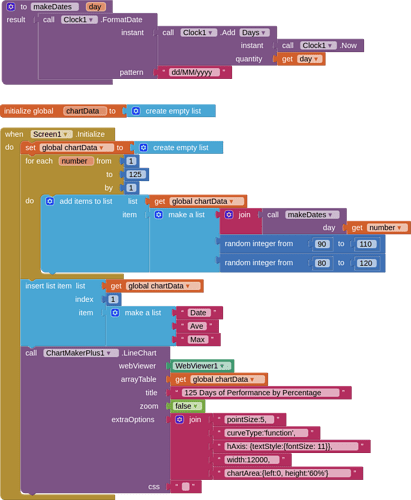
This part:
Which method ?
Don't understand what you are doing from your partial showing of blocks
Show an output of the data you are sending to the chart.
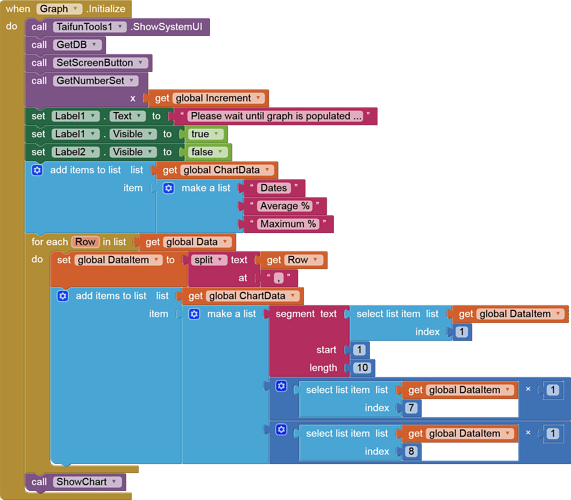
Thats a partial view of where the dates are input into the list. The full view is this:
I need the dates along the bottom of the graph under each point.
Make sure that each date is a string, if it looks anything like a date/number google charts will not like it (as much)
Hmmm the dates were input same way before and did show up fine before I began trying to scroll
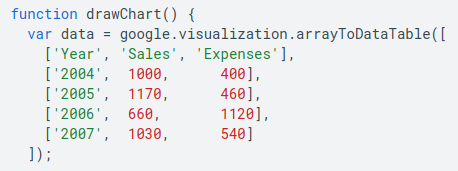
An example of the arrayTable you are building:
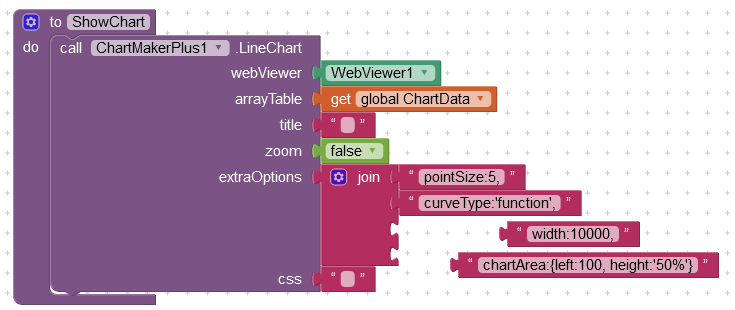
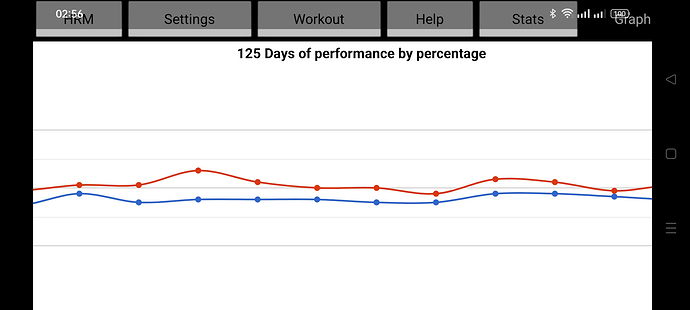
First Version:
Produces This:
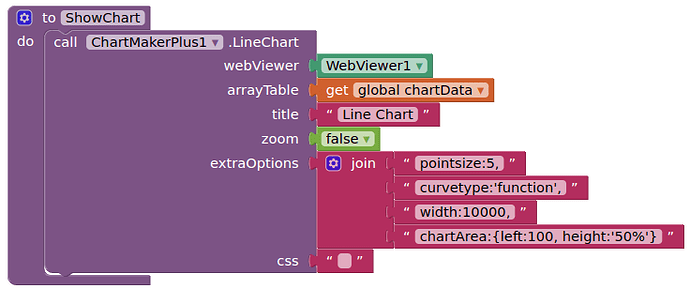
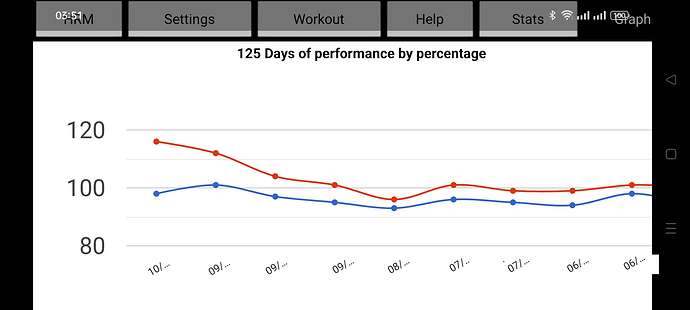
Your Way:
Produces This:
In the first version the dates (05/15/2023 format) are not fully displayed, I think due to crunching of so many data points.
Your version produces no dates at all.
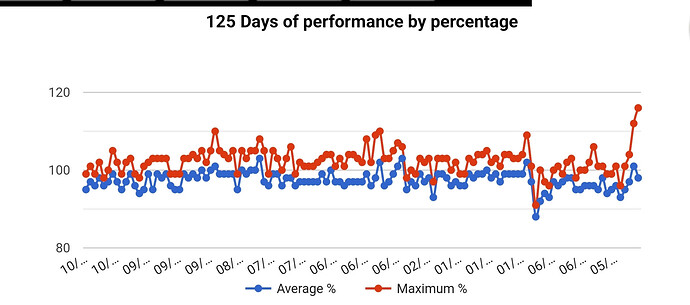
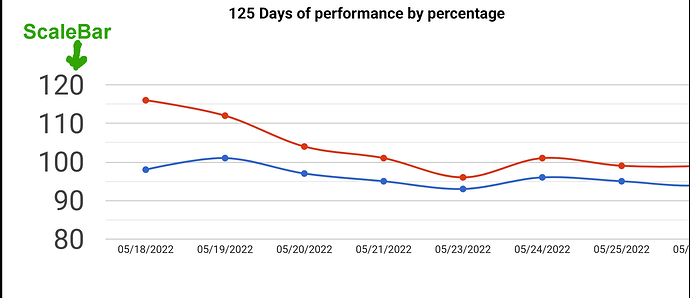
I don't know all the commands for extraOptions but I am hoping to find a way to get something that looks similar to this:
With (full) date along bottom and a persistant scale bar as I scroll
Is this at all possible?
Is there a list of commands that can be sent to extraOptions?
Can you share your dataset, I can have a play
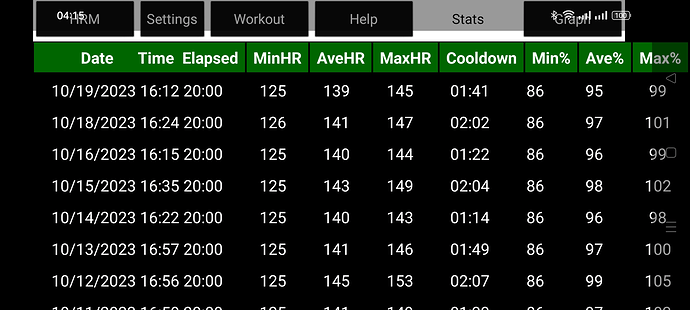
I do not know how to retrieve it as a package to be sent but I have this statistic picture to show the layout of the dataset (minus the commas)
Get the value of your global chartData, copy and paste here as text (a partial image is of little use)
[["Dates", "Average %", "Maximum %"], ["05/18/2022", 98, 116], ["05/19/2022", 101, 112], ["05/20/2022", 97, 104], ["05/21/2022", 95, 101], ["05/23/2022", 93, 96], ["05/24/2022", 96, 101], ["05/25/2022", 95, 99], ["05/26/2022", 94, 99], ["05/27/2022", 98, 101], ["05/28/2022", 95, 101], ["05/29/2022", 96, 106], ["05/31/2022", 96, 102], ["06/02/2022", 96, 100], ["06/03/2022", 95, 100], ["06/04/2022", 95, 98], ["06/09/2022", 98, 103], ["06/10/2022", 98, 102], ["06/11/2022", 97, 99], ["06/12/2022", 96, 101], ["06/13/2022", 97, 100], ["11/22/2022", 93, 96], ["11/23/2022", 94, 97], ["11/24/2022", 92, 100], ["11/25/2022", 88, 91], ["01/05/2023", 97, 101], ["01/07/2023", 102, 109], ["01/08/2023", 99, 104], ["01/09/2023", 99, 103], ["01/11/2023", 99, 103], ["01/12/2023", 99, 104], ["01/13/2023", 99, 104], ["01/14/2023", 97, 101], ["01/16/2023", 99, 103], ["01/17/2023", 98, 102], ["01/19/2023", 100, 105], ["01/20/2023", 99, 104], ["01/21/2023", 99, 104], ["01/24/2023", 98, 102], ["01/25/2023", 99, 103], ["01/26/2023", 96, 99], ["01/27/2023", 96, 99], ["01/29/2023", 97, 102], ["01/30/2023", 96, 100], ["02/01/2023", 98, 103], ["02/02/2023", 99, 103], ["02/03/2023", 99, 103], ["02/04/2023", 93, 97], ["02/06/2023", 98, 103], ["02/07/2023", 97, 102], ["02/08/2023", 99, 103], ["02/09/2023", 96, 99], ["02/10/2023", 97, 100], ["02/11/2023", 95, 98], ["06/08/2023", 103, 106], ["06/09/2023", 101, 107], ["06/10/2023", 99, 105], ["06/11/2023", 97, 103], ["06/12/2023", 96, 103], ["06/14/2023", 102, 110], ["06/15/2023", 98, 109], ["06/16/2023", 96, 102], ["06/17/2023", 99, 108], ["06/20/2023", 97, 102], ["06/21/2023", 97, 103], ["06/23/2023", 97, 104], ["06/24/2023", 97, 104], ["06/25/2023", 96, 101], ["06/26/2023", 97, 103], ["06/27/2023", 97, 101], ["06/28/2023", 100, 104], ["06/30/2023", 97, 104], ["07/01/2023", 99, 103], ["07/04/2023", 97, 102], ["07/05/2023", 97, 101], ["07/07/2023", 97, 101], ["07/09/2023", 97, 101], ["07/10/2023", 97, 102], ["07/11/2023", 96, 99], ["07/12/2023", 98, 106], ["07/14/2023", 98, 103], ["07/15/2023", 96, 100], ["07/20/2023", 99, 103], ["07/21/2023", 99, 105], ["07/22/2023", 96, 99], ["07/23/2023", 97, 105], ["08/17/2023", 103, 108], ["08/18/2023", 100, 105], ["08/19/2023", 100, 105], ["08/20/2023", 99, 103], ["08/21/2023", 100, 105], ["08/25/2023", 95, 99], ["08/26/2023", 99, 105], ["08/27/2023", 99, 103], ["08/30/2023", 99, 104], ["08/31/2023", 99, 105], ["09/02/2023", 101, 110], ["09/03/2023", 100, 105], ["09/04/2023", 98, 102], ["09/05/2023", 100, 105], ["09/09/2023", 98, 103], ["09/10/2023", 99, 104], ["09/11/2023", 98, 103], ["09/12/2023", 99, 103], ["09/13/2023", 95, 99], ["09/22/2023", 95, 99], ["09/23/2023", 96, 99], ["09/24/2023", 99, 103], ["09/26/2023", 98, 103], ["09/27/2023", 99, 103], ["09/29/2023", 95, 103], ["09/30/2023", 99, 102], ["10/01/2023", 95, 101], ["10/03/2023", 94, 98], ["10/04/2023", 96, 99], ["10/06/2023", 99, 103], ["10/07/2023", 97, 102], ["10/08/2023", 95, 99], ["10/11/2023", 97, 102], ["10/12/2023", 99, 105], ["10/13/2023", 97, 100], ["10/14/2023", 96, 98], ["10/15/2023", 98, 102], ["10/16/2023", 96, 99], ["10/18/2023", 97, 101], ["10/19/2023", 95, 99]]
I cant believe I figured out how to do that ![]()
Here is my example achieving what I believe you want. You will need to adjust the settings for the y axis in label1, depending on your screen layout.
wideChart.aia (13.4 KB)
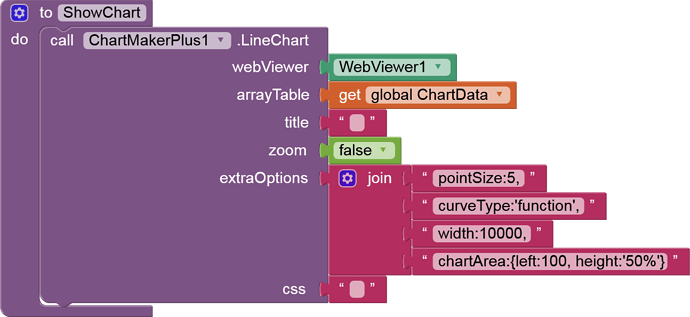
Ok I did that ![]() but I used "chartArea:{left:100" because "chartArea:{left: 0" did not produce a scalebar. This is what I have:
but I used "chartArea:{left:100" because "chartArea:{left: 0" did not produce a scalebar. This is what I have:
This is really great but..
Is it possible to have the scalebar persistant while scrolling?
Can the graph open up to the right end instead of the left? (The left is the oldest data and the right is most important)
Seems you did not test my example aia project, which will show you how to have a static vaxis (if a "fake" one!)
You could reverse the arrayTable data, so that the last values come first ?
Alternatively it may be possible to run a javascript on the chart to scroll it to the right. I will have a look see.
