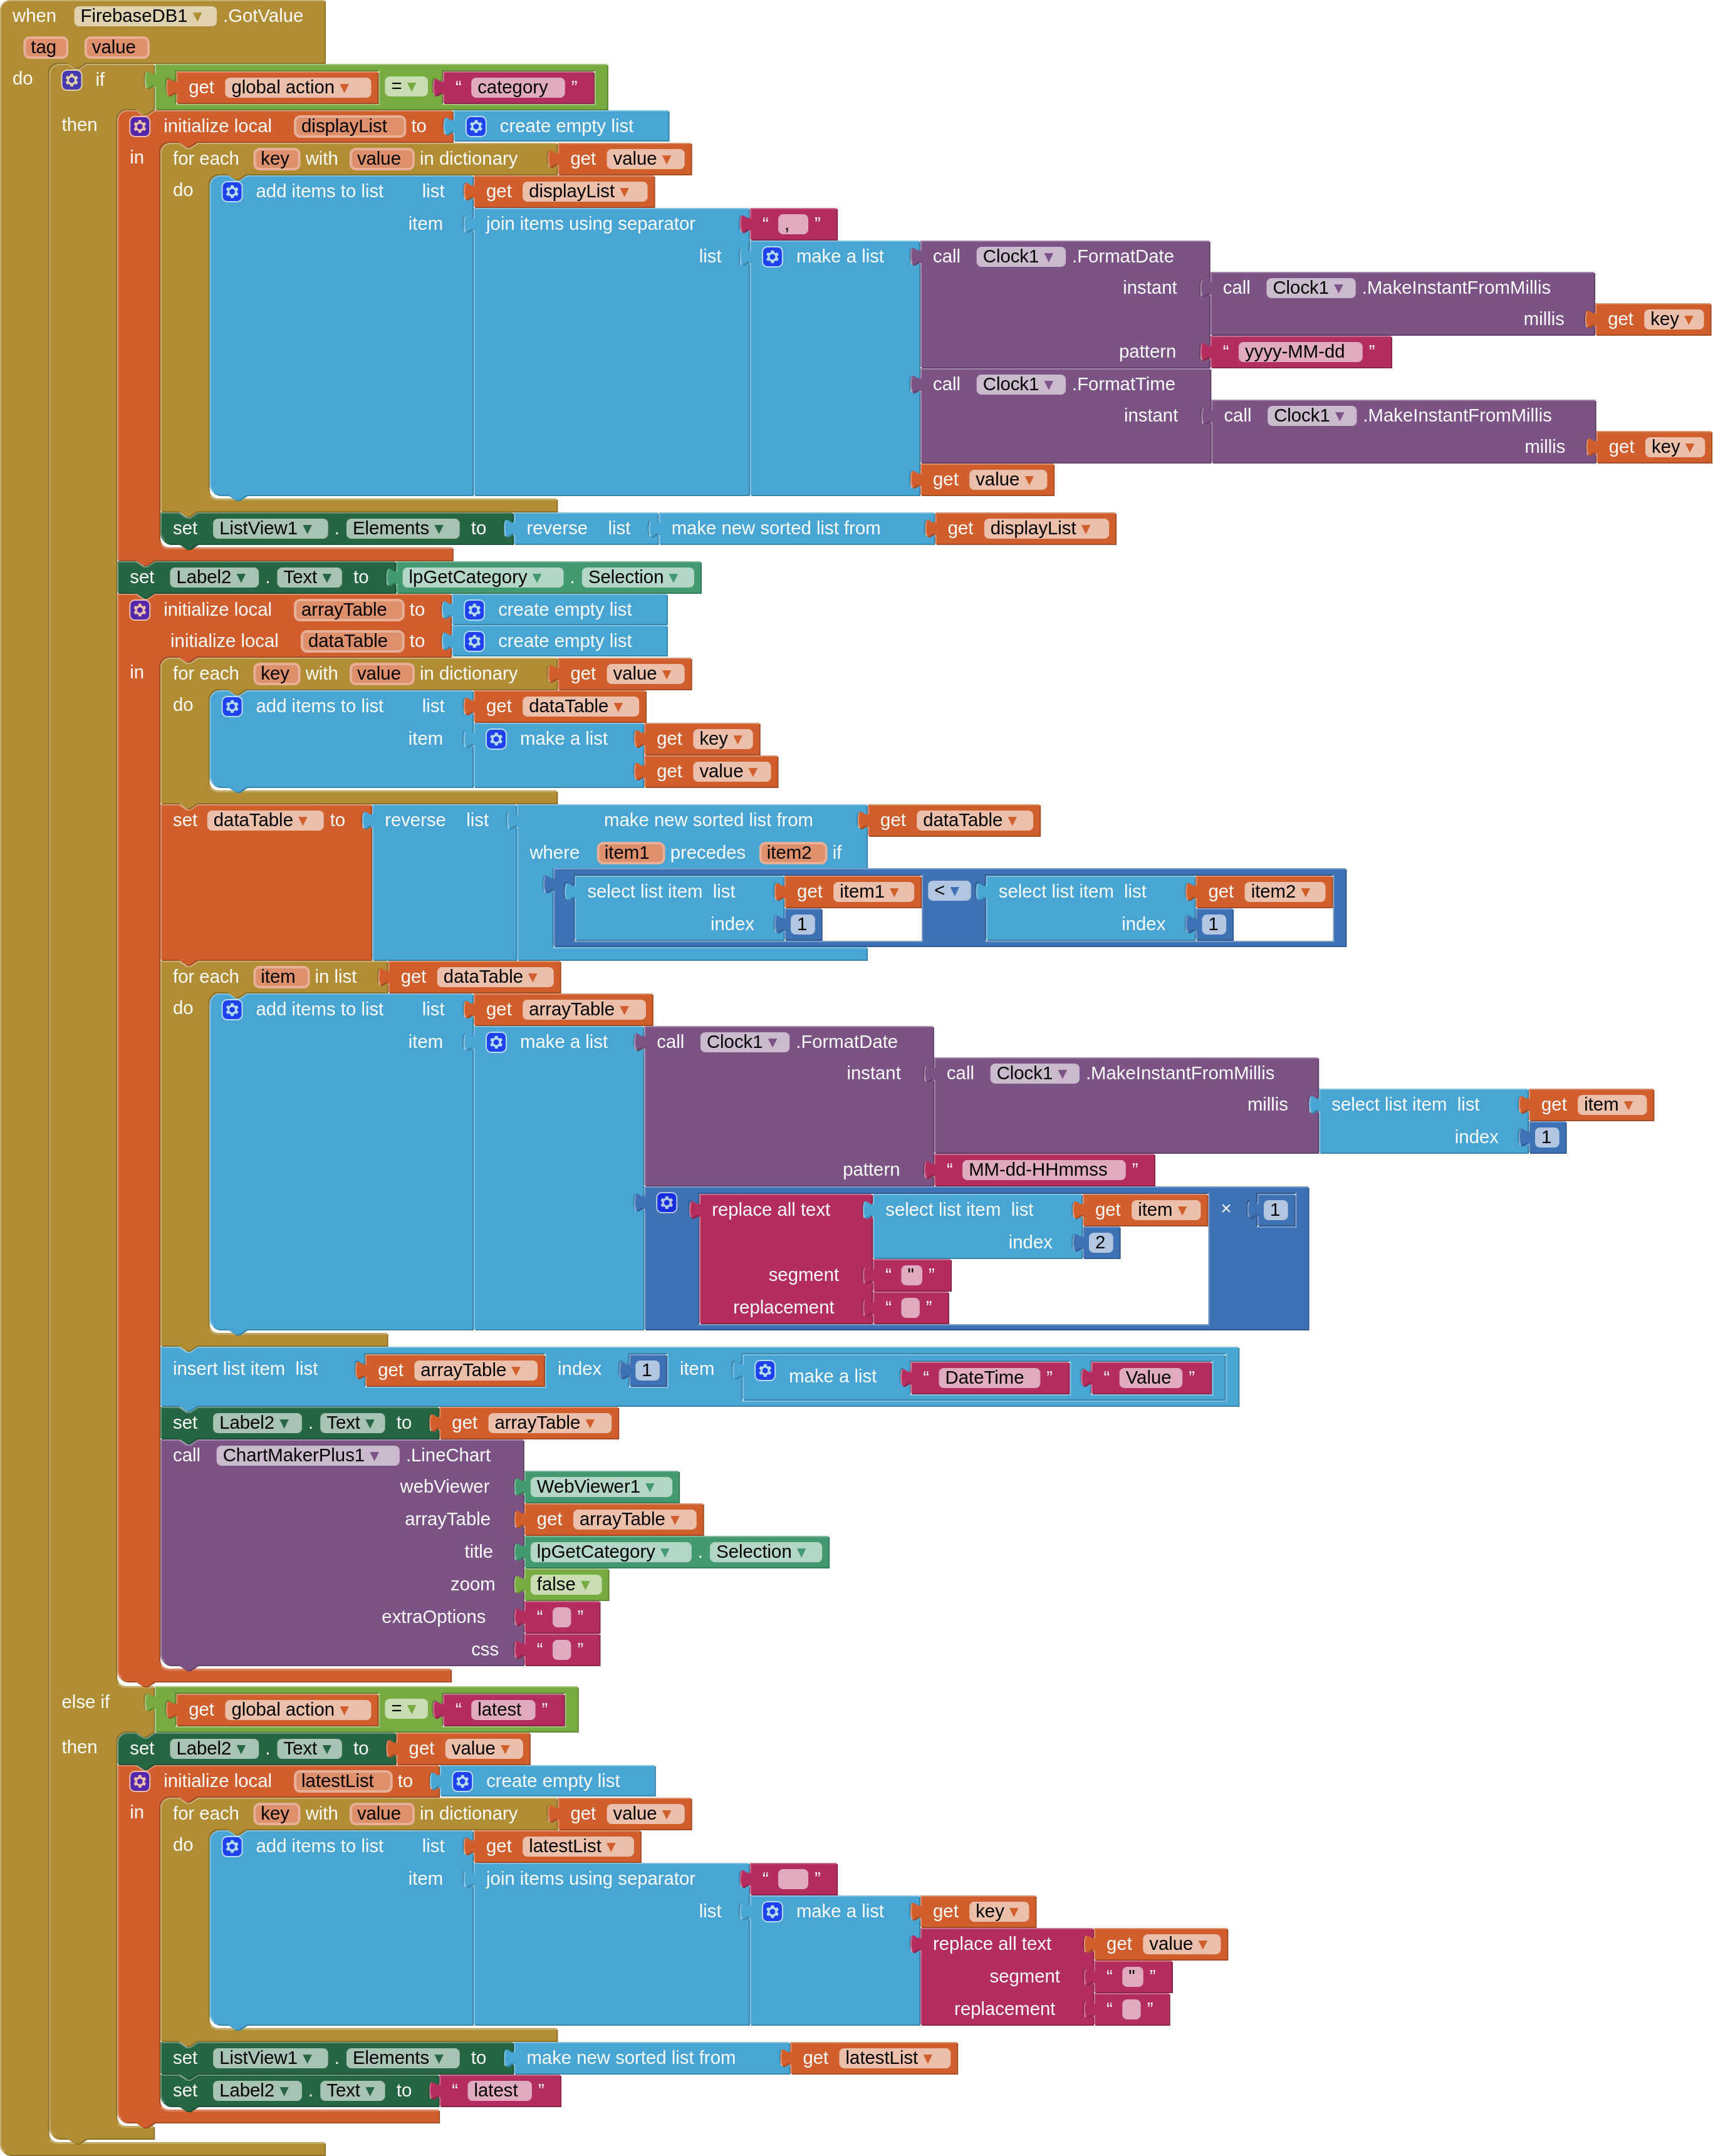
OK, the issue with the chart is possibly where values have the same hour and minute. The solution is to sort the data as it is when it is returned, so sorting the millis values, then to convert the millis to a human readable string value of your choice (MM-dd-HHmm ?) for the chart.
It is possible to "stretch" the chart to the right, and then be able to scroll the data. See HERE
Follow @ABG's advice to find the for each in list block that is causing the problem