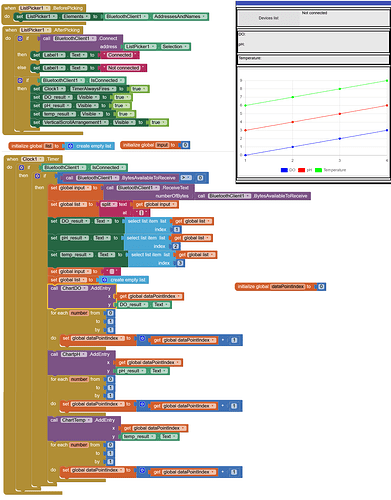
Hello, I'm quite new to the MIT app Inventor so maybe I haven't looked right, but is there a way to make a pointer for the chart? Like when you click on one of the data point, it gives you the x and y coordinates?
I have three graph on the same chart and I would like to be able to see the coordinates of the data point I clicked on.
Also this may need another topic for it but is there a way for the displayed data on the graph to be averaged after a certain time to allow the graph to display more data through time?
Here are my code as of now
Hello,
for the first question, you can get that using an extension like this:
For the second question, you will have to do with code.
Hello, thank you for the solution! If I understood correctly, this extension would replace the chart blocks with the option of having a pointer?
As for the my second question, I don't mind coding but do you know if there's an example code of this somewhere?
right, you have documentation and examples in the link above.
For examples and others, take a look here:
An example maybe can inspire you:
Other interesting topic:
Hello, okay thank you, I will try them then!
