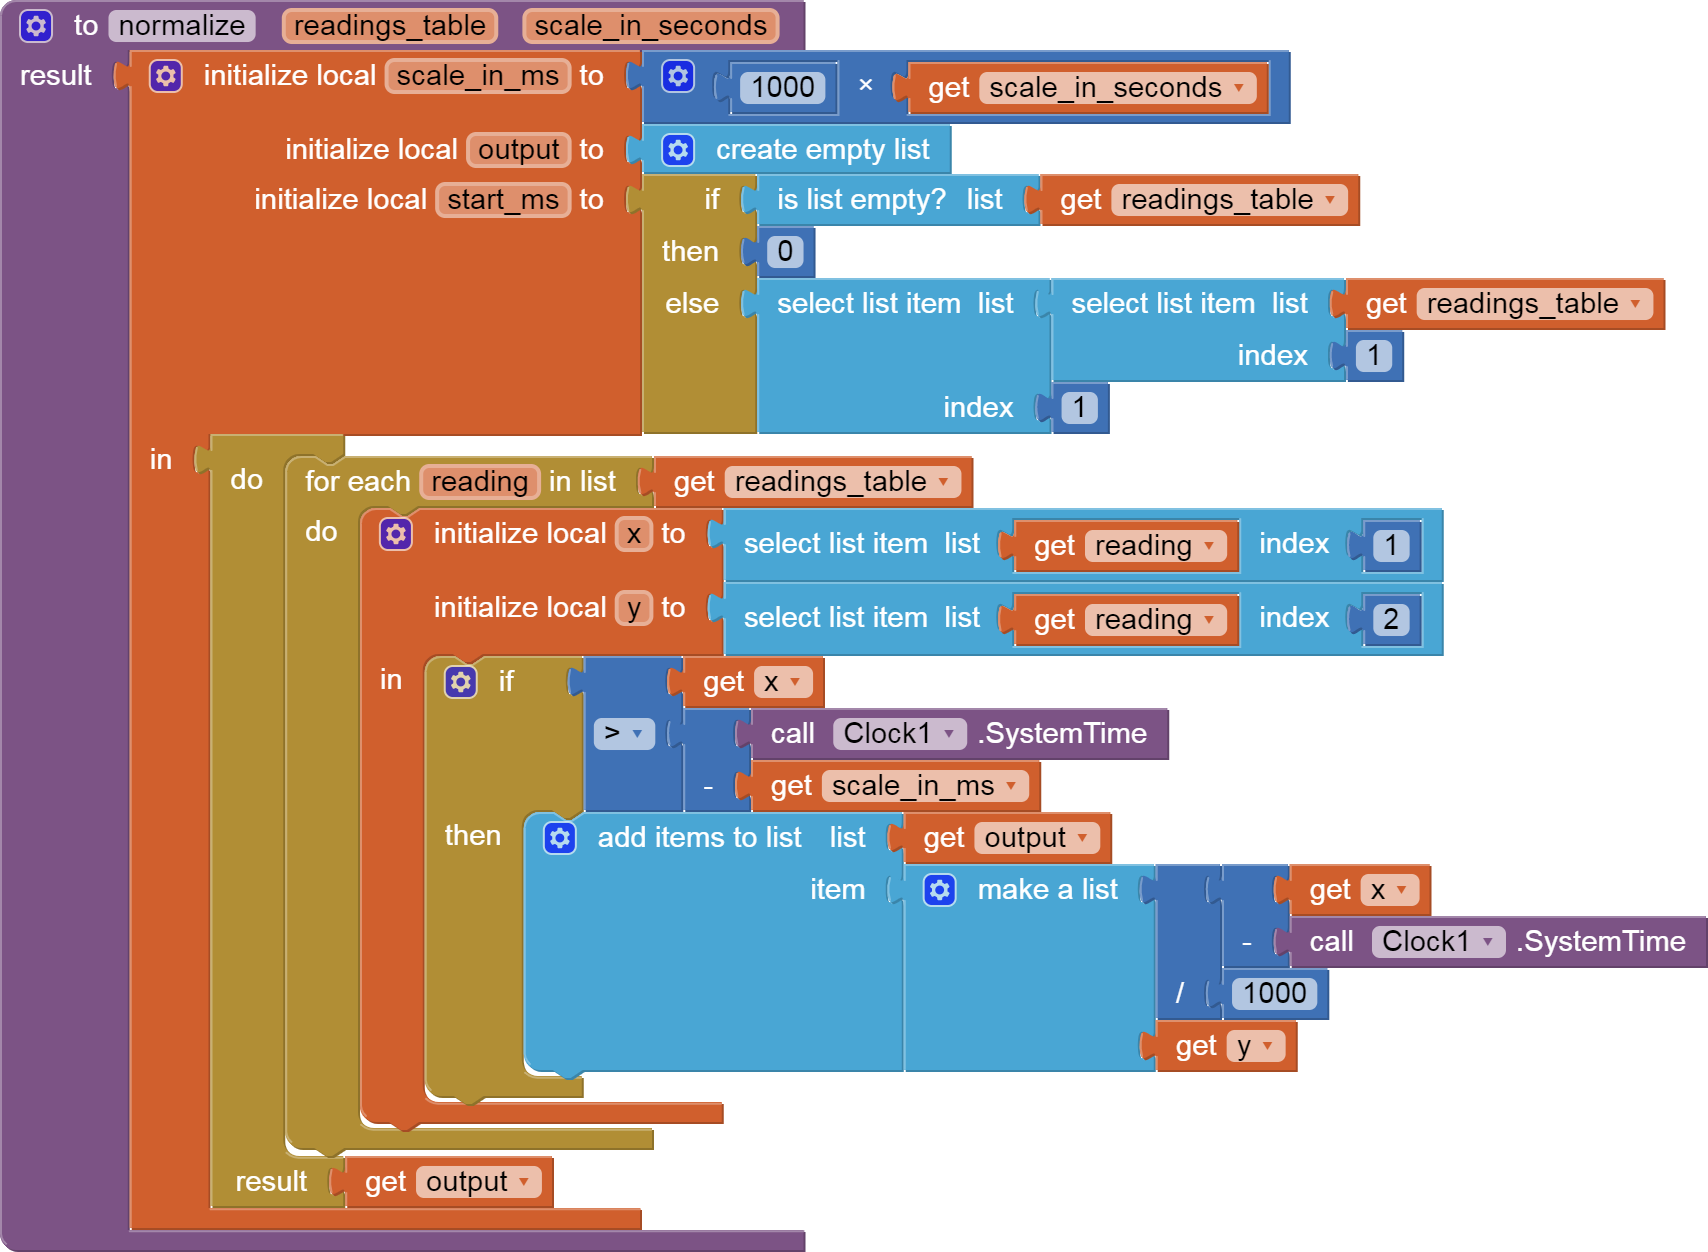
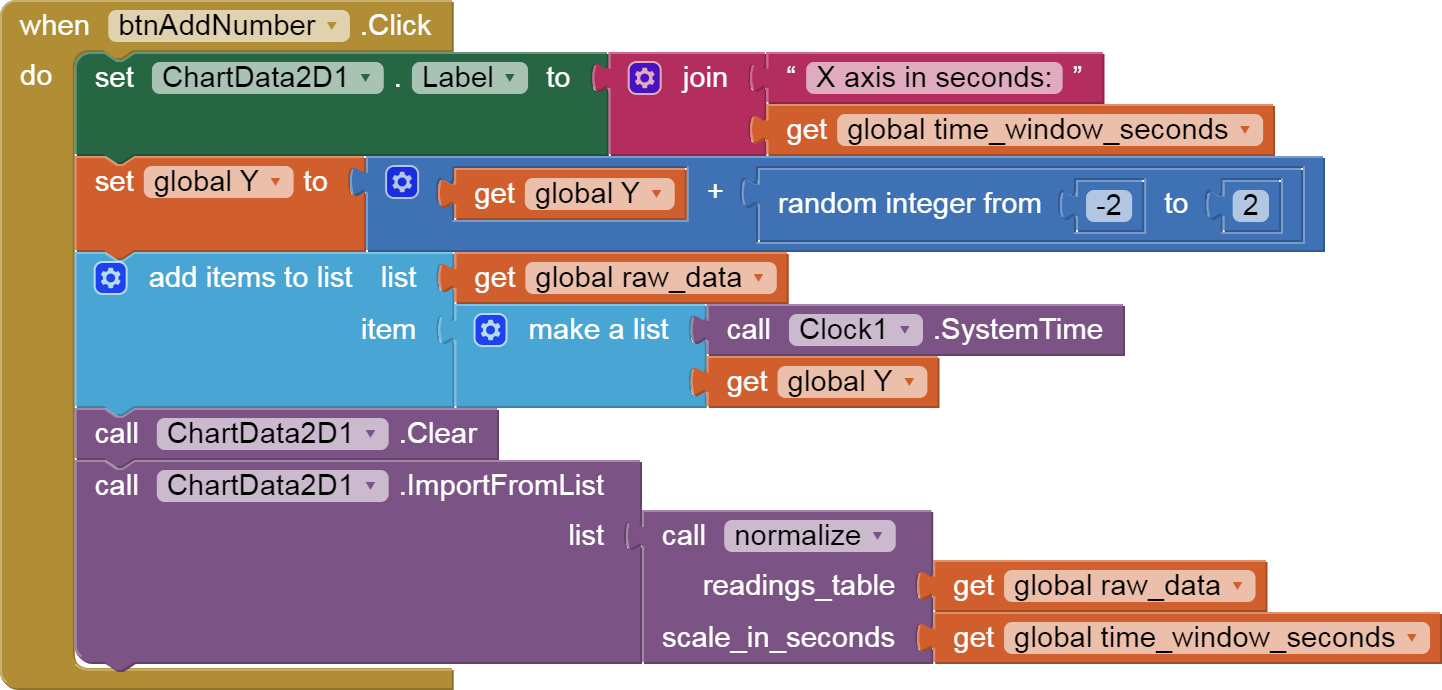
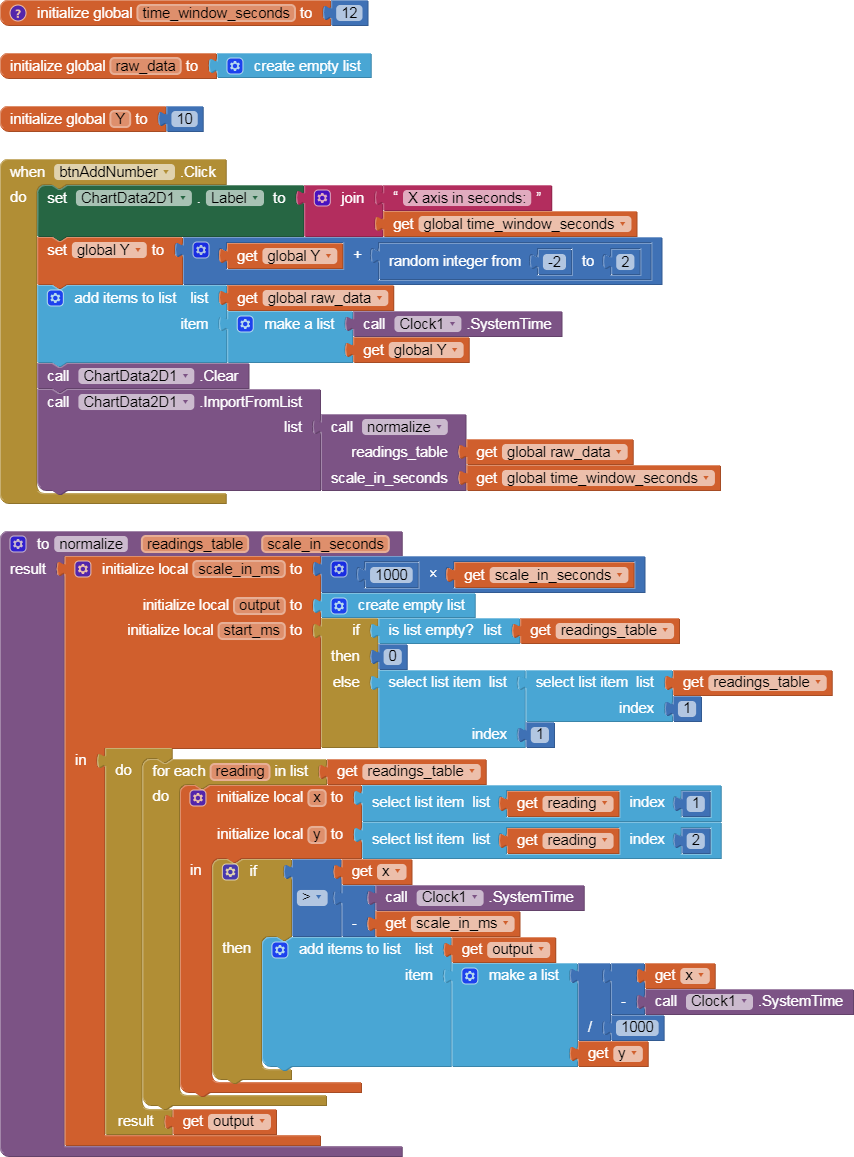
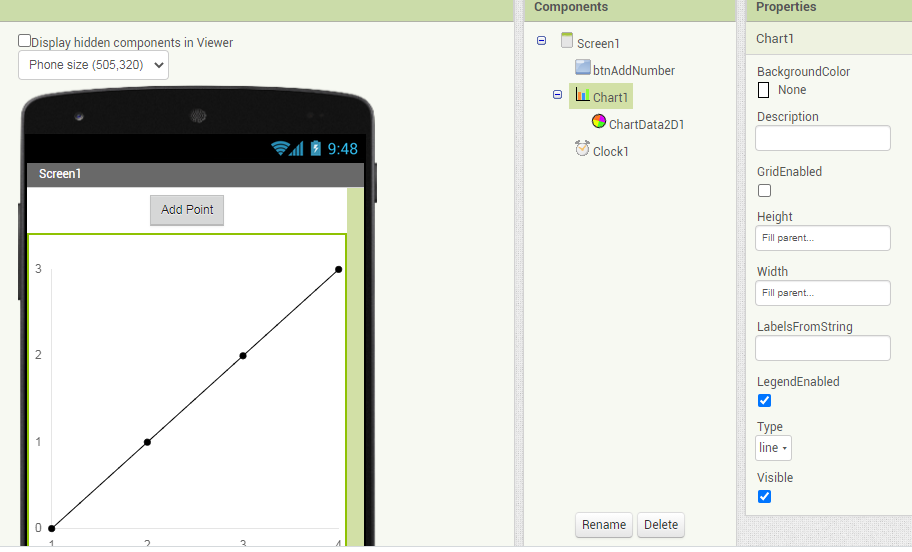
To show how to normalize time based readings to a particular scale, here is an example of the Drunkard's Walk, for the last 12 seconds:
charts_last_hour.aia (3.8 KB)

To show how to normalize time based readings to a particular scale, here is an example of the Drunkard's Walk, for the last 12 seconds: