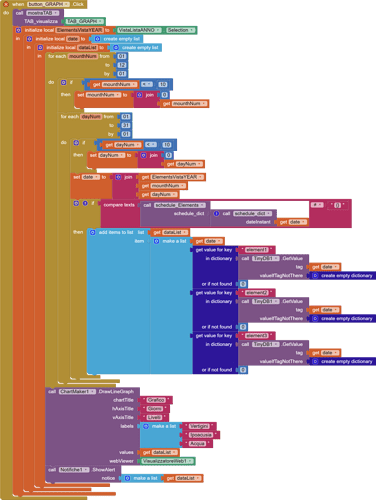
I've created a BLOCK for plot in a graph 3 different value, one for each day in DB. I cant write a DATE in X axis...if i try to use 08/10/2020 chart write the result of the math operation...i've tried with "", '', . etc etc ..i've altro tried to write "new Date(2020,10,8) but don't plot...how may i write the date?
Ty a lot
Please show your relevant blocks and data
Also see here:
for some ideas
The day of the month is a nice number for a chart axis.
I can't use day of mouth because my data Will be for One year...i Need to use "day/mounth" instead. Tomorrow i'll post some code....ty
This is my "graph" block...i need to convert the actual "date" value (yyyyMMdd) in something usable with Google chart .
I believe that showing day/month or any formatted date as an axis label is beyond the capabilities of the chartmaker extension. Google charts requires additional parameters and options to display these correctly.
Workarounds
As @ ABG suggests use the dayNumber - this is available in a date instant
Roll your own google chart, once you get the syntax sorted out you can setup blocks to generate the html to send to the webviewer (see link above for how to)
At the end i've used your sugestion...ty a lot 
I've searched into forum but I havent found any example....may you link me someone? I don't know how I may write html code and send It to Google charts.. TY A LOT
Here is an example using GoogleCharts to make a Gauge. It shows how to make a gauge display two ways, the second way shows a way to work with Google Charts Make an Analog Gauge and use it to display something useful . Reading it may help you understand how to use an html file. Read it along with the post Tim made regarding GoogleCharts ... the https://developers... link to see how to use dates along the x axis.. The two articles show you how you can possibly use GoogleCharts to display your graph the way you want. You will have to experiment. Only you know how you want your line graph to display.
Here is an example that uses the line charts with dates that I linked to above.
I use the webviewstring to add the data, which needs to be evaluated in the script in the html.
googleChartExample.aia (2.9 KB)
This topic was automatically closed 7 days after the last reply. New replies are no longer allowed.
