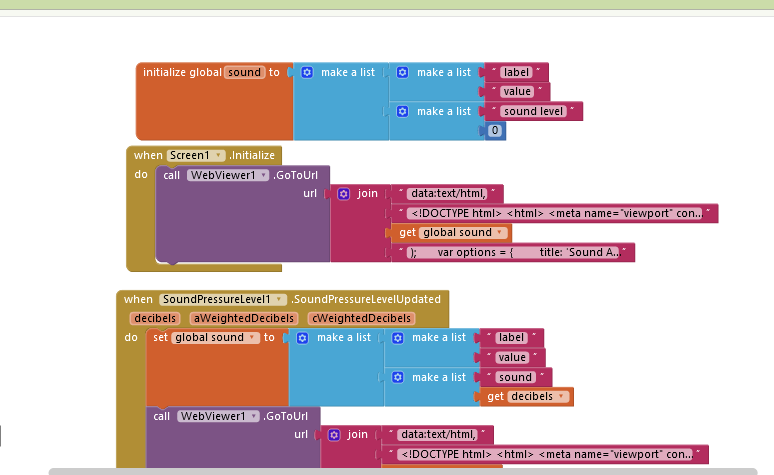
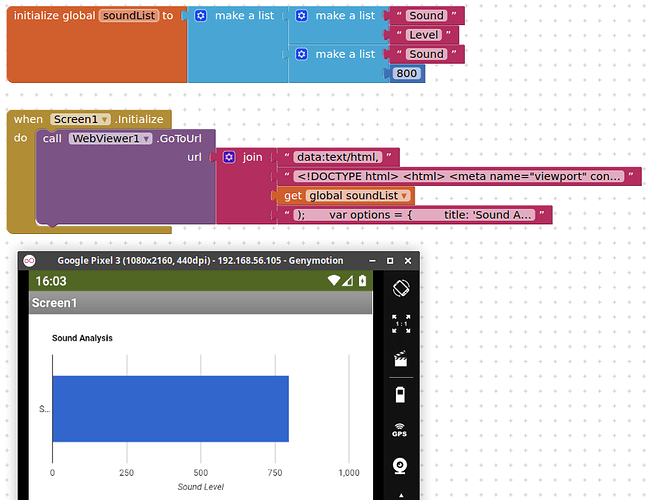
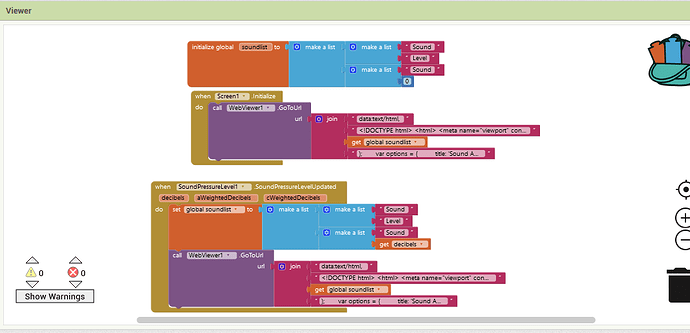
Same method as for the light meter
What does not work, simply no chart shows up, at all?
Not just a blank page
<!DOCTYPE html>
<html>
<meta name="viewport" content="width=device-width, initial-scale=1.0, maximum-scale=1.0, user-scalable=no">
<head>
	<title>BarSound</title>
	<script type="text/javascript" src="https://www.gstatic.com/charts/loader.js"></script>
</head>
<body>
	<div id="chart_div"></div>
	<script>
	google.charts.load('current', {packages: ['corechart', 'bar']});
    google.charts.setOnLoadCallback(drawMultSeries);
function drawMultSeries() {
      var data = google.visualization.arrayToDataTable(
soundList
);
      var options = {
        title: 'Sound Analysis',
        legend: {position: 'none'},
        chartArea: {width: '90%'},
        hAxis: {
          title: 'Sound Level',
          viewWindow:{
          max:1000,
          min:0
          }
         },
      };
      var chart = new google.visualization.BarChart(document.getElementById('chart_div'));
      chart.draw(data, options);
    }
	</script>
</body>
</html>
You should also check the values coming back as decibels, they may be quite small, using a different scale to 0 - 1000....
Now he came
But I think it is not connected to the voice recognition sensor because it does not increase the sound of its effective environment
noone? 

duplicate topic ...moving
I understood to mean that the graph was now working?
Did you check the values being returned by the sound analyser ?
No not working
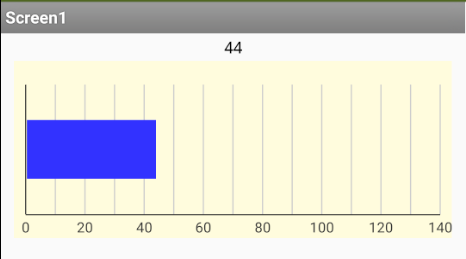
In a fixed value
Remaining constant value
I want to adjust the ambient sound
I realise that, I simply wanted to check if the basic setup worked.
Yes, it worked
@bita
You must change over time the value of the variable.
Here is a modification of the code used by @SteveJG
Gauge_alt.aia (44.4 KB)
Edit:
App with extension com.KIO4_VUmeter.aix
Gauge_alt_v2.aia (55.9 KB)
Here with Canvas:
p139Ci_Extension_Microfono_VU.aia (10.1 KB)
Try this works for me
SoundAnalyser2.aia (30.8 KB)
Note: Google Charts is probably not the best solution for what you want to do, due to the delay in updating the chart and the chart blinking when it does update. What is needed is an on device charting solution which will be offered by the upcoming built-in Chart component, or can be done now using the canvas, or by signing up to High Charts and using their javascript on the device.
Thank you was great


