Hello, sorry if i posted in the wrong section. I try to develop an aplication that takes data from a RealTime Database and put the data in a Chart. I need to have the time (HH:mm) on the x axis and the data on y axis. I tried some extension but no luck. I know that ChartData2D from Mit can't handle string format. Any sugestion or help on what I should do?
I look at that but don't help me. I need to make a graph of an heart rate and i need to keep the before values
Show some example data in firebase.
If you want to update every second, then you would need to build your own google chart for this.
After some time spended for solving this I did some work but now I'm getting some errors
Bad Arguments to remove list item(The opperation remove list item cannot accept the arguments : ,[6] , [1])
Select list item : List index too large (Select list item : Attempt to get item number 1 of a list of lenght 0: )
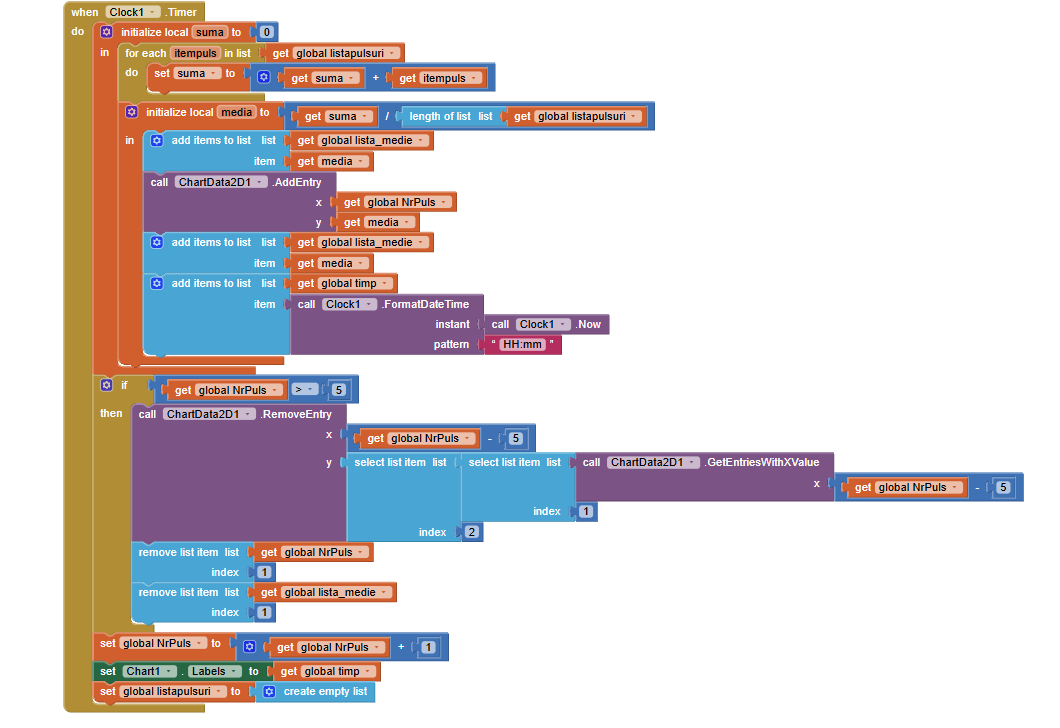
that is the code
I think i see the problem on remove item for NrPuls, brb
Do It is very useful for this.
This topic was automatically closed 7 days after the last reply. New replies are no longer allowed.