Part II Custom Map Overlay
.. Show the user on the Map and a Custom Map Overlay. Add map 'control' information to the Display.
How to Build this App
Part I to this tutorial explained how to make the Custom Map Overlay. This part explains ways to animate and do interesting things with the overlay using the Maps control's object Properties.
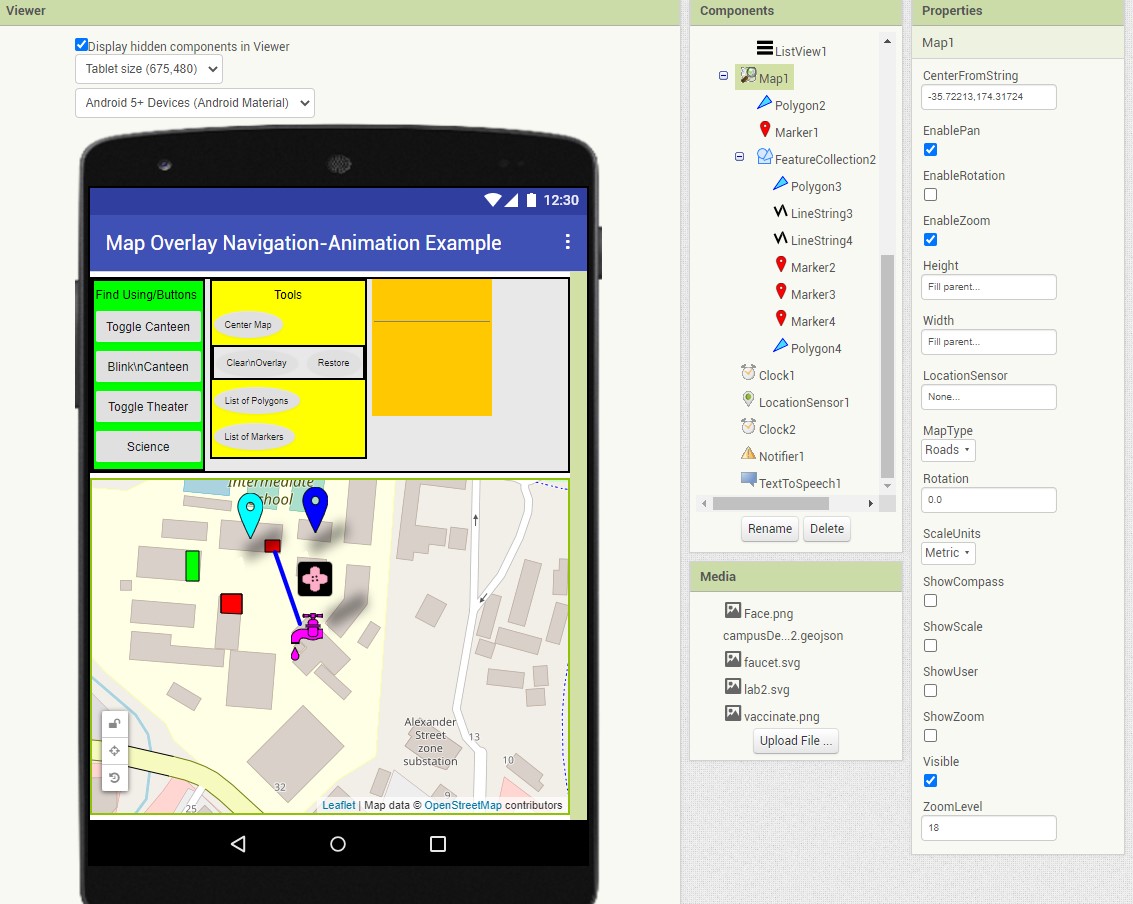
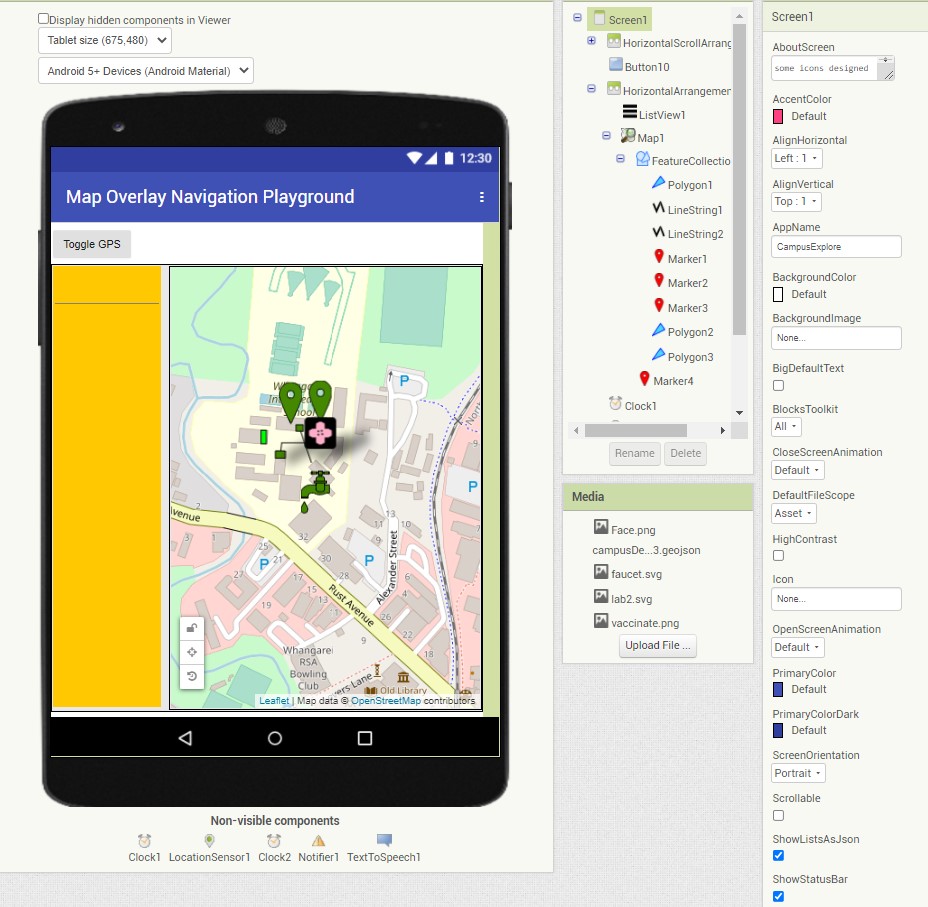
This is the map overlay playground experiments Designer.
The tutorial example app works in Android 4.2 - 8.1. It is built using only Blocks. Whether it works in higher operating system versions I do not know. Try the example aia.
How the Interface to the Overlay is Built
The example app is designed on a Tablet. The example aia will run on small cell phones too. For small screens you it may be necessary to adapt the location of some of the controls.
Developers use these App Inventor tools and should familiarize themselves with the documentation:
Housekeeping
- Set the Scope in Screen1 Properties to Asset (to access Media compatible with App Inventor 2 nb187 and higher).
Use the Location Capabilities of the App
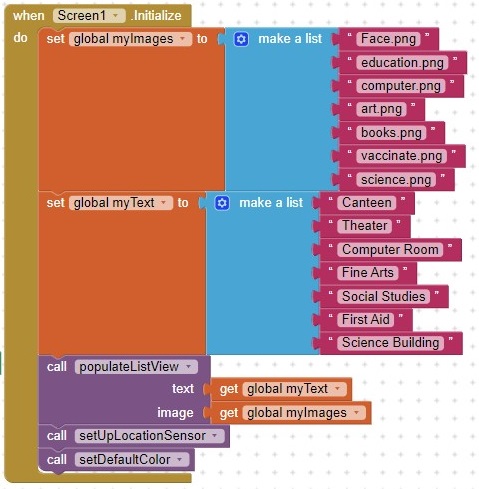
- Show the user's location using a LocationSensor and the Map component. The code is in the Procedure setUpLocationSensor. The Procedure is called in the Screen1.Initialize Block.
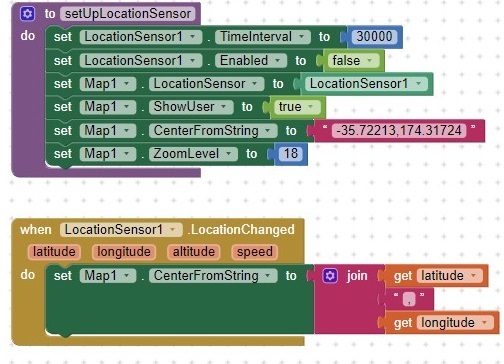
The ShowUser Block provides an icon at the Android's current location( provided the device's Settings allow Location and the GPS is enabled).
Your location probably will not display in the example overlay area immediately but will display on an expanded Map (perhaps set the Zoom to a value of 2 or 3 to find out where you are in relation to the map overlay?
How to Animate (dynamically modify) the Objects in the Overlay
-
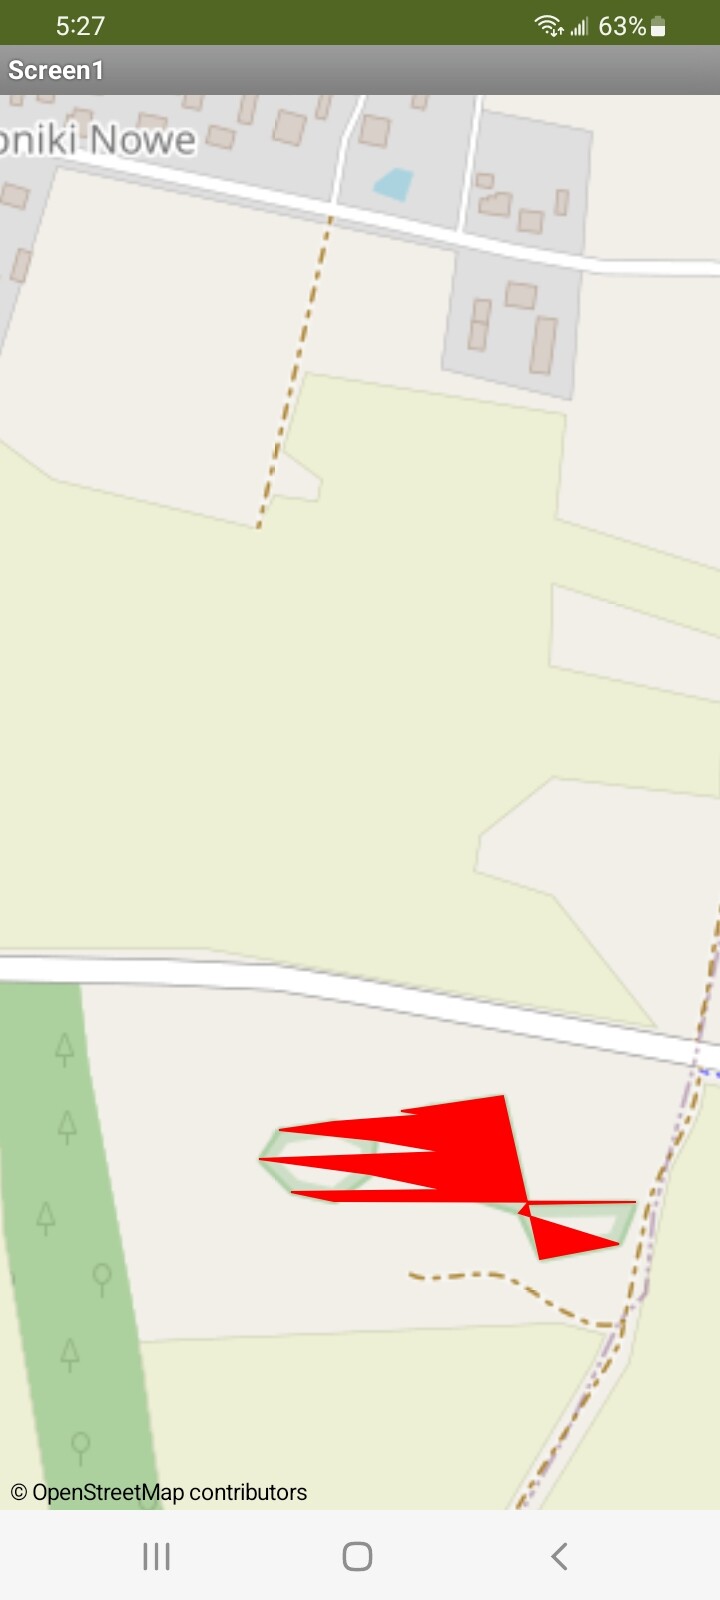
Affix a Title and Description to the pop up Infobox associated with each object. Use the Designer Property options or Blocks. When the object is touched an Infobox (a pop up) appears only if you check EnableInfobox in the component's Properties in the Designer or set enabled with Blocks. Enabling the ability to use the object's pop up can be set with Blocks. However in the tutorial example, enabling is set using the Designer Properties of each object. Basically, EnableInfobox is checked; FillColor is changed to what color you prefer and the component is given a Title and/or Description that will display in the Infobox .
-
POI's. You can assign CustomMarkers to your markers using the Markers in your overlay or add the Markers using the Designer. Points of Interest can be represented by a graphic. The parameters for the example (Marker1) are set in the control's Properties on the Designer but can be set in Blocks. The Any components Blocks can also set all the Markers you display in your overlay as CustomMarkers. Basic Pin Markers can change color. Some svg images can change color; png and jpg images cannot be color changed.
-
Multiple FeatureCollections are possible. Several overlays can coexist simultaneously. If you add a second FeatureCollection that contains some of the same objects you drew in another loaded overlay; those duplicate objects create coding issues. The issues can, with difficulty, be overcome. If you add a second FeatureCollection, ensure it does not contain previously drawn objects and avoid issues.
-
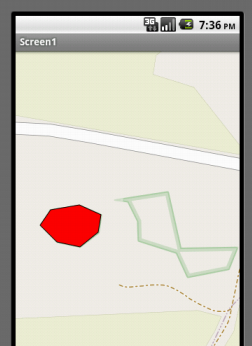
Change the Polygon, Marker or LineString object's color and otherwise manipulate objects with the Designer Map Properties for that object. The changes are made using the object's Properties on the Designer screen. Changes can be made using code.
-
Polygon.ShowInfobox and Polygon.HideInfobox are not working; a bug MIT has the Block on its to do list. Marker.ShowInfobox and Marker.HideInfobox work fine!
-
Add a building locator tool to the Screen. Either a ListView (or ListPicker) or a Button is used to change an object's color temporarily to help locate it on the map. The tools provides a toggle. Basically all objects except CustomMarker png or jpg files can be toggled with color. SVG file CustomMarkers do change color. A Marker Infobox can be controlled with Blocks. Unfortunately, at the moment, because of a bug, the ShowInfobox method is only working for Markers. Other map components do not.
-
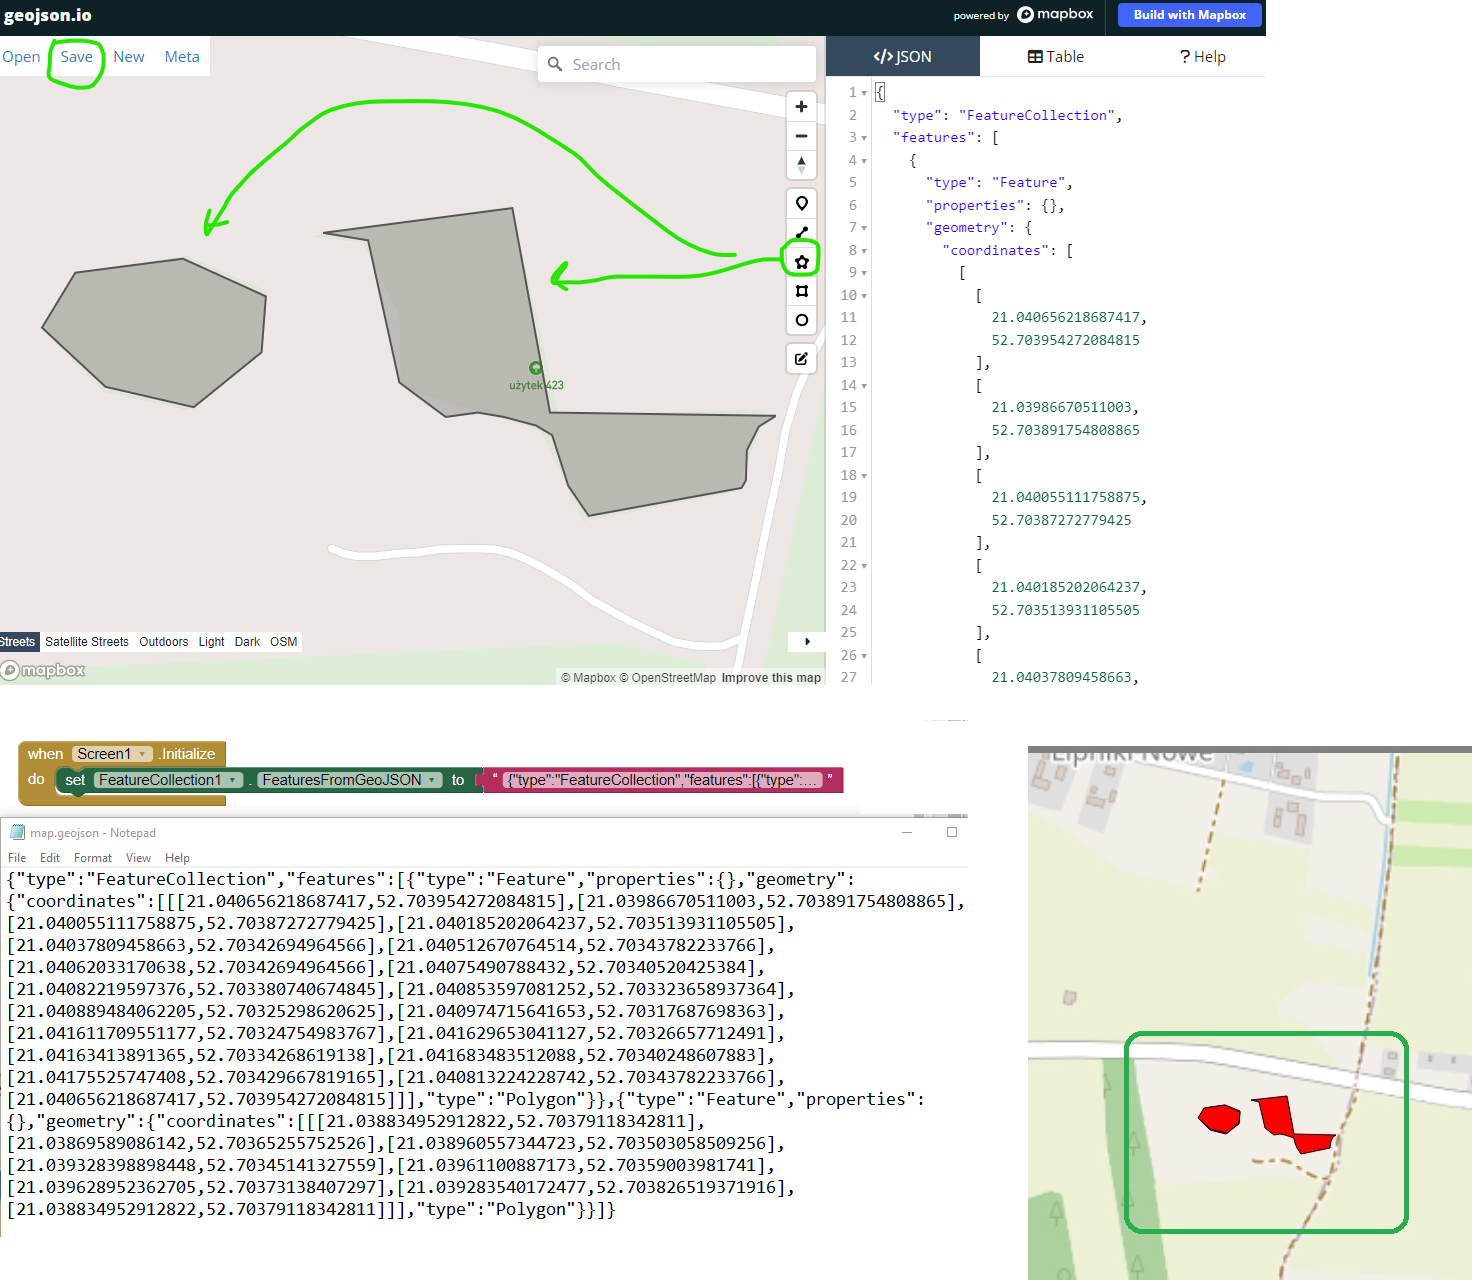
Did you forget to include something in your overlay. Add additional features to the map from the Designer to the display independent of the FeatureCollection or revise the geojson overlay file.
- Drop a Marker, Polygon or LineString on the map. Modify the object in the Designer. A caution. Adding individual polygons is more difficult than using the web site tool to create them. It is possible and may be convenient to use the Designer to place Markers. Use the Designer to supplement the polygons and lines you placed with the geojson overlay as separate objects. See http://ai2.appinventor.mit.edu/reference/components/maps.html .
- A relatively simple way to update your overlay is to load a previously created geojson (Open > File ) on the geojson web page; select the file and continue working on it. Save the modified FeatureCollection you just modified with a different name; then reload the geojson into Media.
How to use the example animation/navigation techniques
There are several basic animation types:
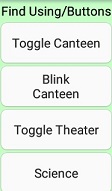
- The Find/Using Buttons examples show how to blink or change the color of an overlay object. An object can be momentarily highlighted by changing its color using Buttons or a ListView in the example. Not all the objects on the map overlay are currently enabled to do this.
-
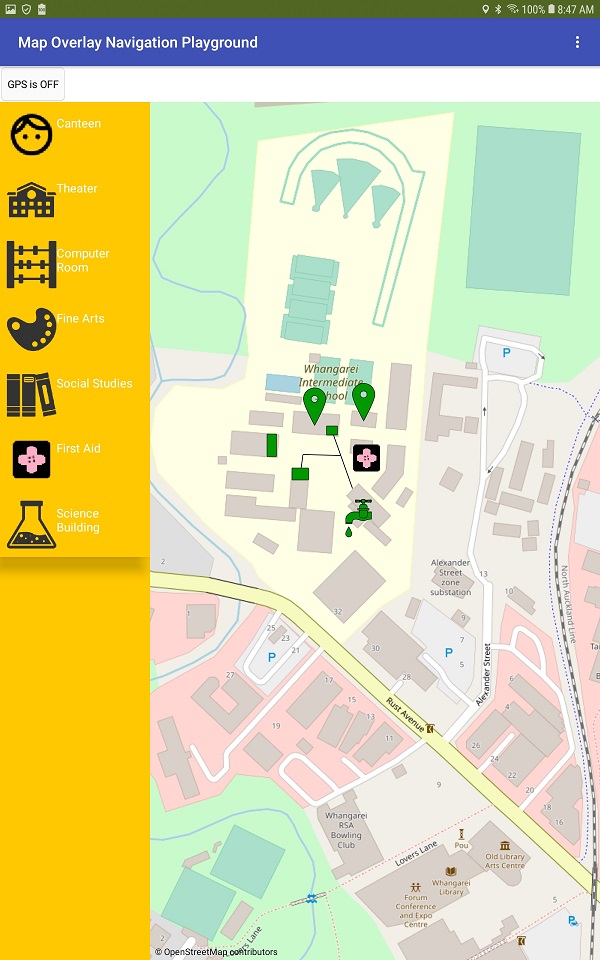
Toggle Canteen - Button5. Changes the canteen color.
-
Blink Canteen - Button8 . Use a Clock to blink.
-
Toggle Theater - Button6. Provides an announcement of current play.
-
Science - Button7. Changes color of the svg image.
-
The ListView duplicates some of these capabilities and provides animation for additional components.
Press the Button or Click the ListView item associated with an overlay item to change its color; press again to revert to the original display.
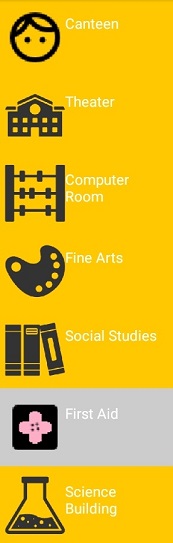
- Tools. Re-center the map overlay, hide and restore the overlay, create a List of Markers or Polygons in the FeatureCollection (useful if you need to change icons etc. of related items). and List of Markers and changing their icon.
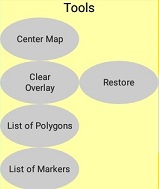
- Center Map - Button1. Centers the map overlay.
- Clear Overlay - Button4 Hides the FeatureCollection (visible = false)
- Restore - Button9 Shows the FeatureCollection (visible = true)
- List of Polygons - Button2 Provides a warning message. The Navigate School Campus shows an application of the technique.
- List of Markers - Button3 Provides a warning message. Items 4 & 5 use this routine
How to use the Map Overlay Animation Demonstrations

campusDetail6.aia (18.1 KB)
Press the Button or Click the ListView item associated with an overlay item to change its color; press again to revert to the original display.
The animation features are not yet optimized (the example does not track which features an object is currently using) and using different types of modification (without reverting to the original) can result in confusion. Avoid this if you limit the way something can be done when coding your real app; the example shows various ways. You probably do not want to use all the techniques in an actual app.
A Clock is used to blink a Marker or a Polygon. Two examples are shown, each has its own Clock component (Toogle Canteen - ButtonB5 and Blink Canteen - Button8).
The aia containing all the experimental code is called campusDetail6.
=========================
Navigate School Campus
The Part II example is a compilation of techniques to manipulate the map overlay. The controls do not look very pretty. CampusExplore is the aia of a partially completed app using a map overlay. The technique can be used on a map of a school campus or park to help a visitor to find things. Keep the interface simple.
campusExplore.aia (16.0 KB)
Useful code while working with an advanced version of this app
How make a Procedure to strip the runtime names of the Markers from a FeatureControl .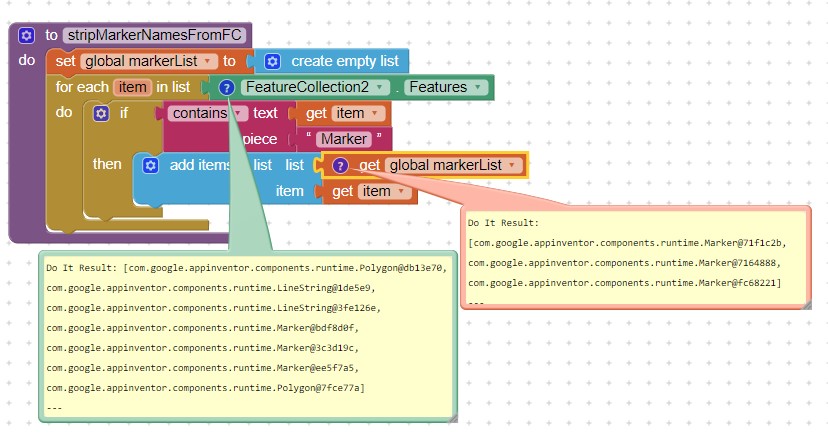
A List of the Markers in the Project is useful while using an Any component Marker control.
When you import a Map Overlay FeatureCollection, all the components are colored Green. This is a routine to re- set the color of all the objects. 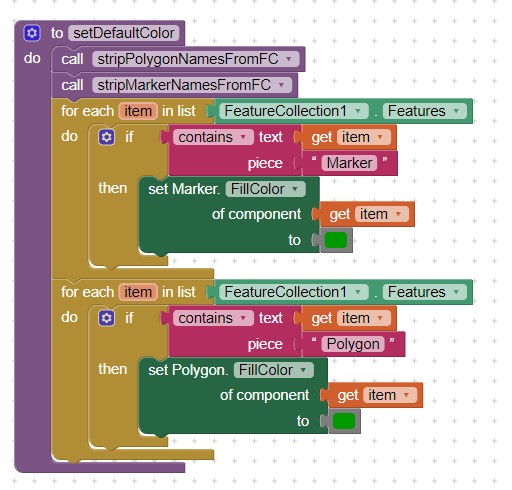
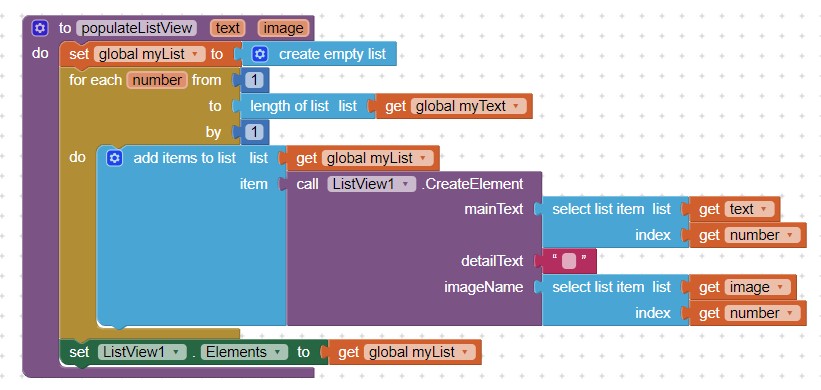
How to set up the new ListView items available since the release of App Inventor 2 nb187. Use the new ListView.CreateElement Block as shown. There are probably other ways to fill the ListView items.
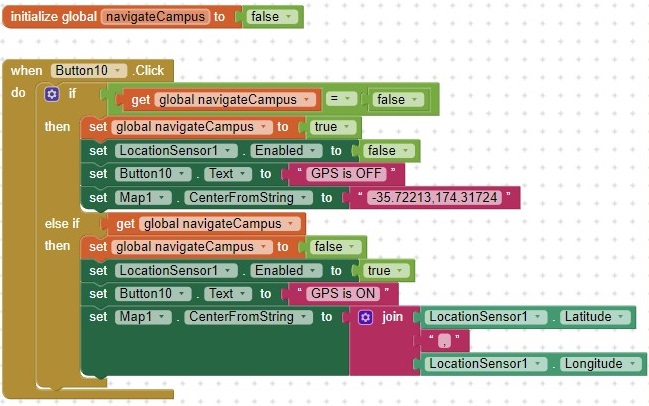
Toggle the GPS off to view the campus overlay when your device is not near the campus.
What next?
This is an example, not a completed app. As a developer you can make this work the way you want it to. You can:
-
adapt the code using your own map overlay.

-
use a similar map overlay to create a Pokémon-like game. Combine a Map with a CloudDB control perhaps. Use a routine to determine if the user is near a Marker or Polygon that has it's opacity set to a low value and resets opacity to a highly visible value when at a certain distance. 'Capture' that object if the user is within it's boundaries.
-
create a virtual geocaching app. Use Marker.DistanceToFeature or BearingToFeature or BearingToPoint to find the virtual geocache that is on the overlay map. Some ideas for geocaching in Texas.. This is a way to build a treasure hunt app.
-
add a function to calculate the straight-line distance between the app user and one or more of the FeatureCollection objects.
-
create a function to determine if the user has arrived at a map overlay 'destination'.
-
use small images as CustomMarkers to display photos of campus buildings, park features etc.
-
enable Map ShowZoom (to provide a + / - feature to zoom the map.
-
enable Map ShowScale to provide a distance scale on the map.
-
enable Map ShowCompass to provide a small compass but only on the most recent Android versions.
-
provide multiple map overlays
-
and add whatever your imagination and coding skills allow using only Blocks or using extensions.
Requirements for Part II
- Either a WIFI or network connection to access the Internet to display the map and the user's location
- gps hardware in the device
- a LocationSensor component
- no extensions required
- intermediate to advanced App Inventor coding skills
Reality check:
-
Navigating inside a building. When your FeatureCollection polygons are inside a building your Android device GPS might not know where it is at while inside the building. Expect reduced gps Accuracy or the inability to achieve a satellite fix or trigger a LocationChanged even when inside a building unless the room has windows.
-
the Map control works using the server at OpenStreetMaps. This means the app requires either a WIFI connection or a cell network connection to access the Internet and the map.
-
during busy periods, the OSM server may be slow to render on your device. Sometimes the pop up fails to display when an object is touched.
Just try again.
Credits: some free images used in the tutorial curtesy of and designed by Dreamstale.
Notes: The Map control cannot be moved once placed on the Screen. When building an app using the control you might want to place the Map in a Layout so you have control of your GUI.
Resources:
-
How to know if your device is located within the bounds of a polygon. Determining if a user's location is within the boundaries of a FeatureCollection Polygon
-
need more resources? Use the community search facility (magnifying glass) to research topics of interest.
Regards and great coding  ,
,
Steve