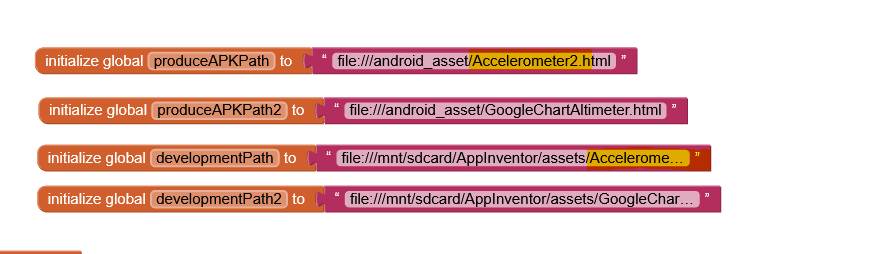
Hello all, i hope everyone is in a good condition and doing well
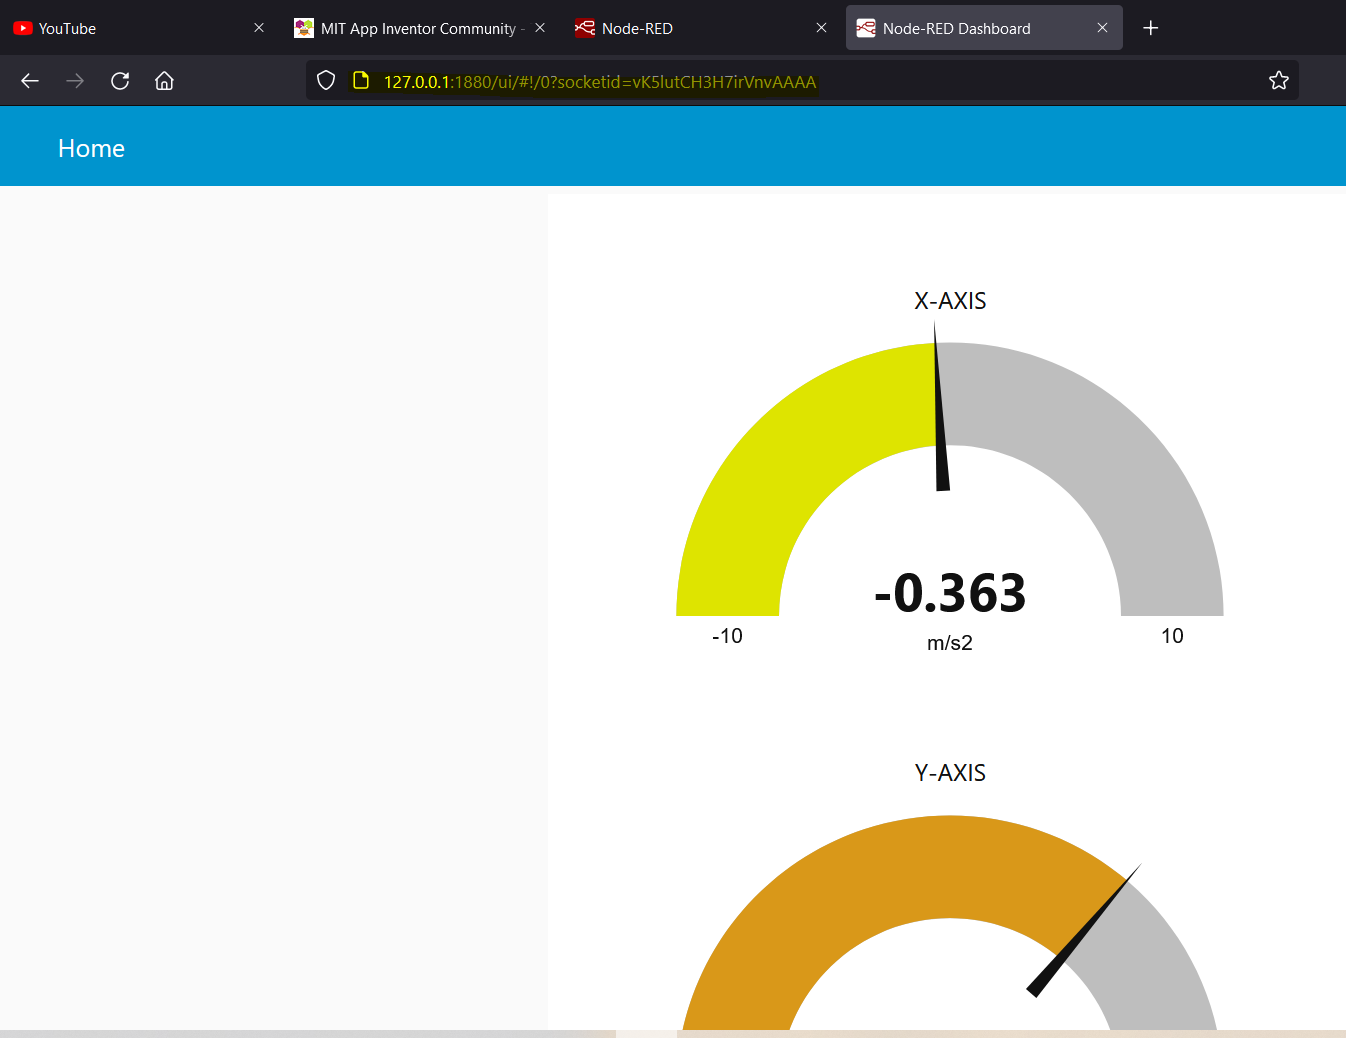
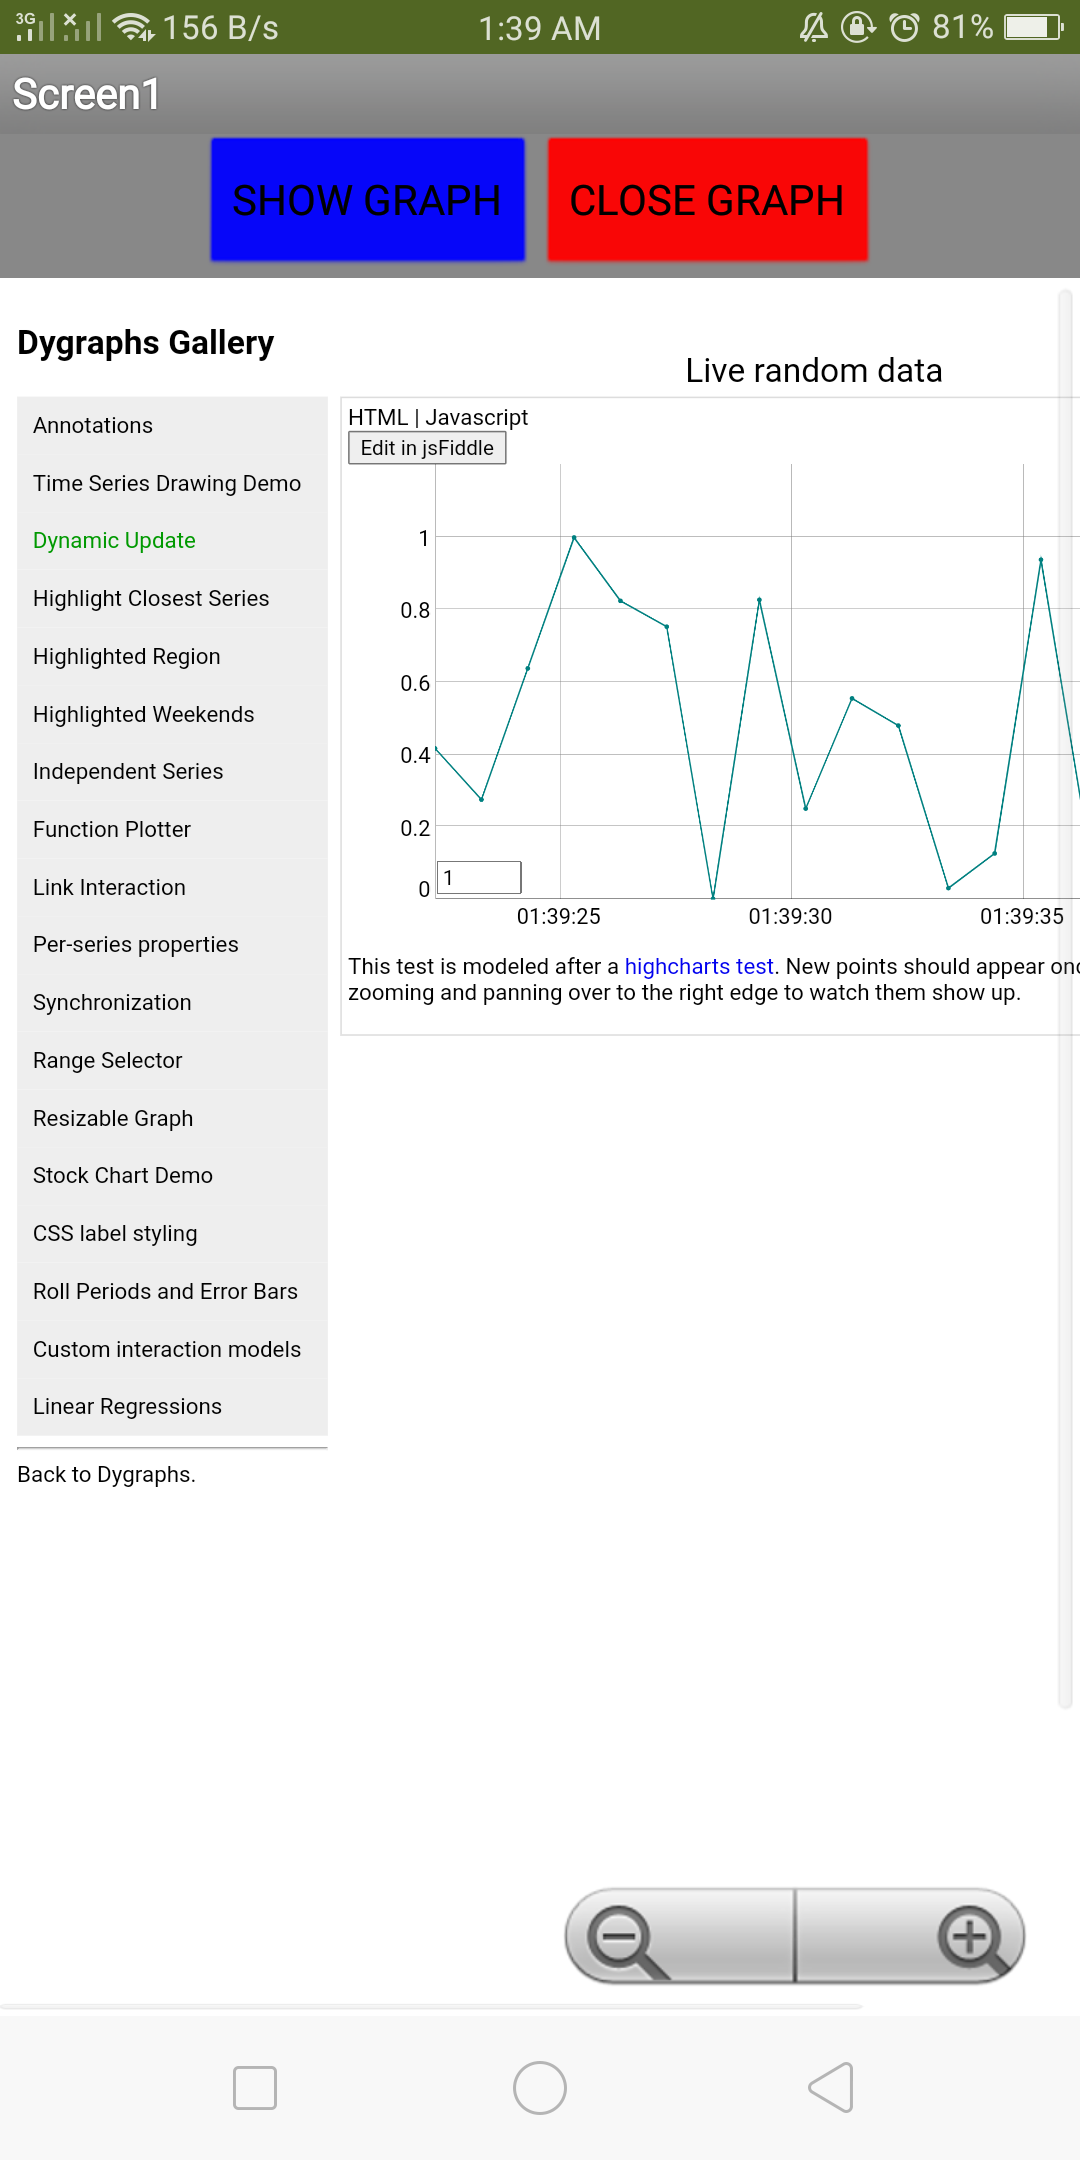
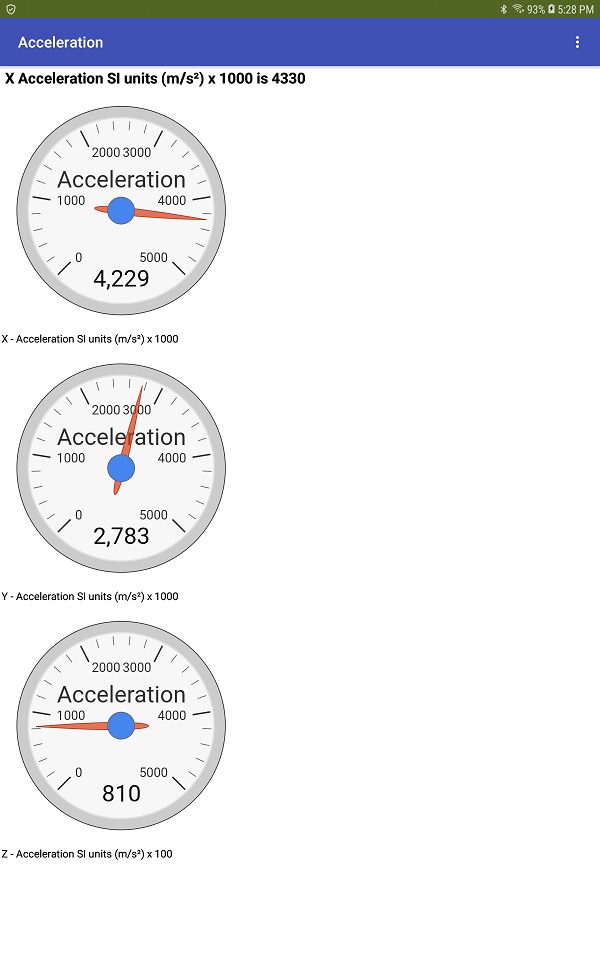
recently i have developed app that send data accelerometer data to MQTT (thanks to @Juan_Antonio),after that i have send the data to node-red to visualize the data received , so now i want to visualize the data in the application...something like shows the graph in the application.
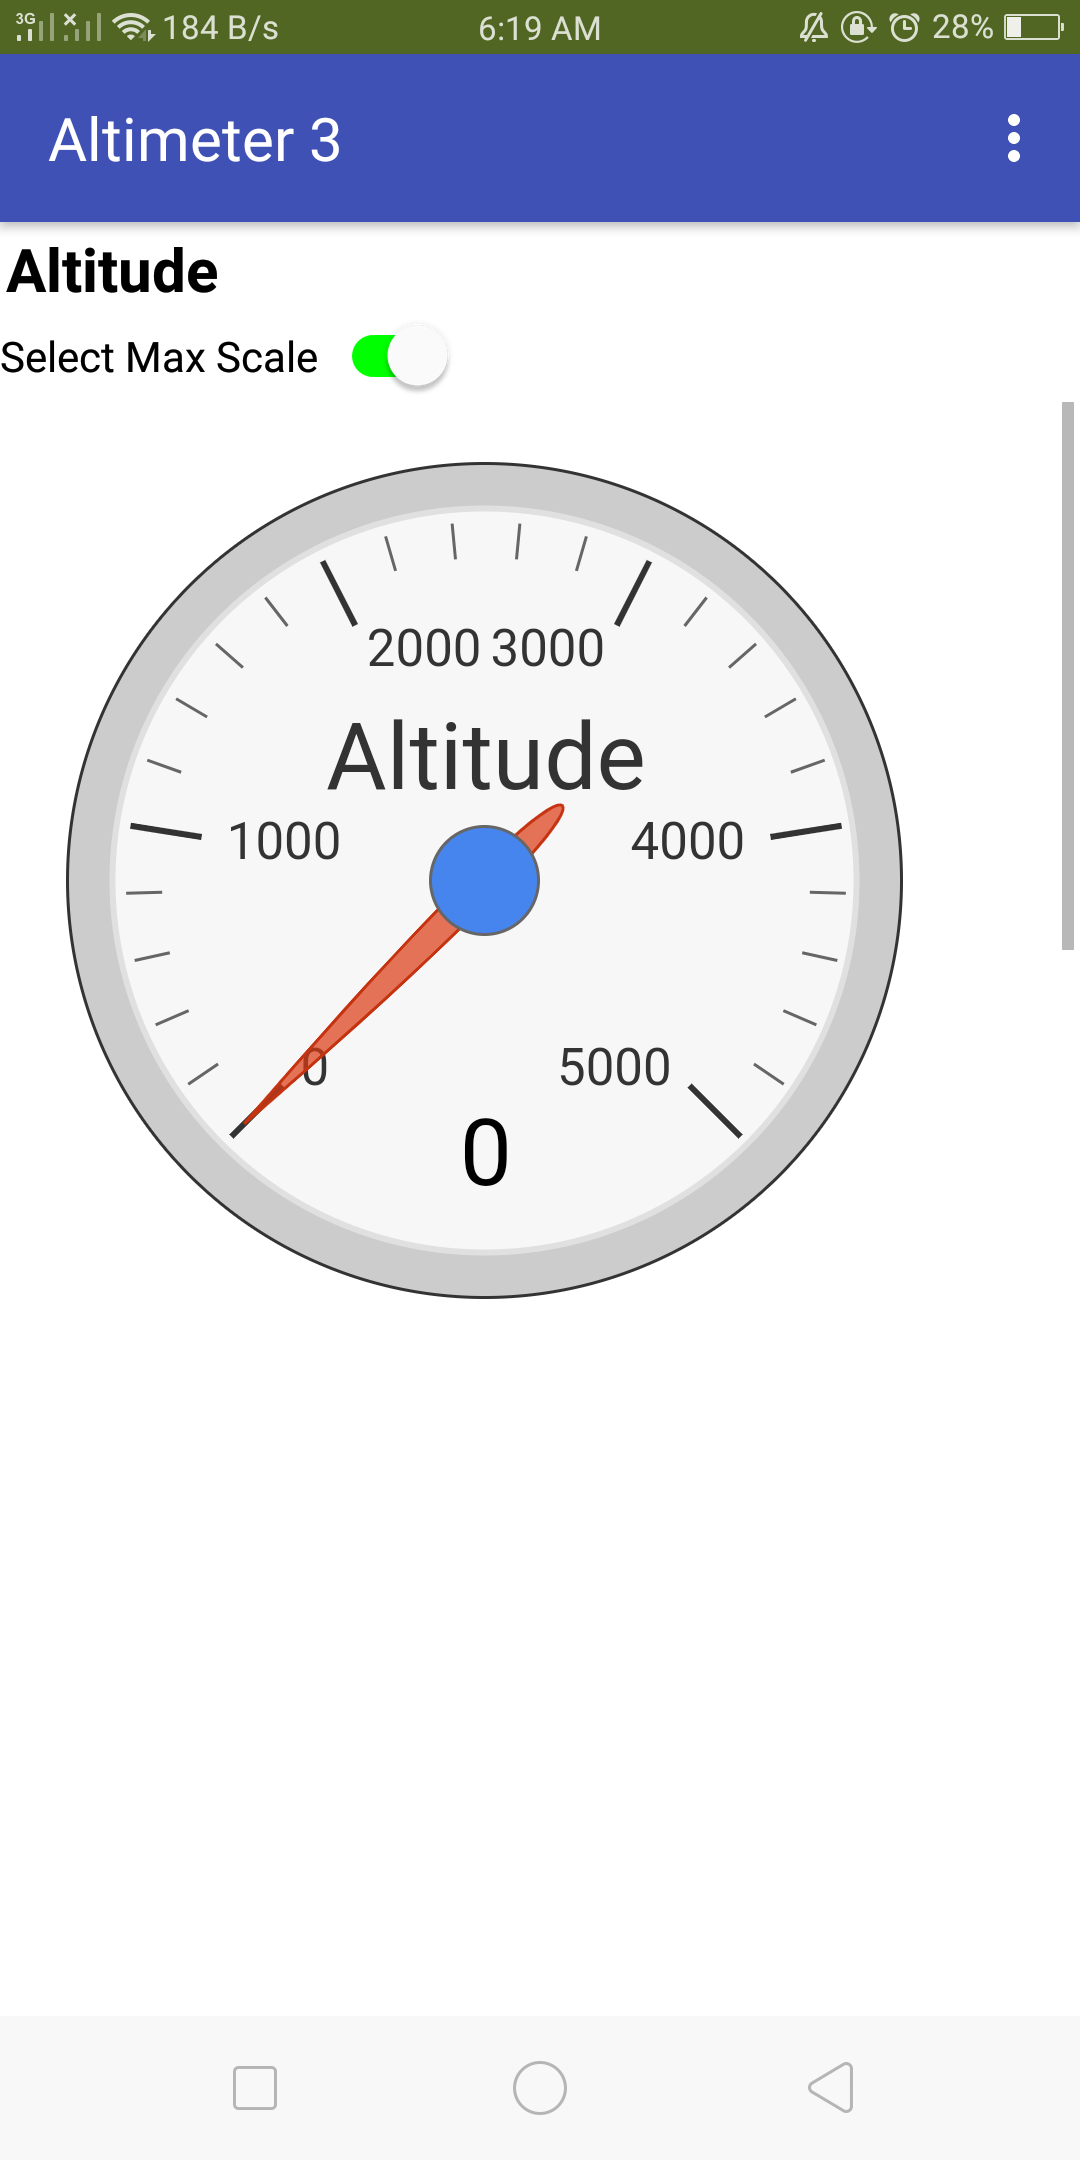
i have been trying and the extension does not work(or maybe it just me),, i did try the sample project which i import and run on AI companion but does not produce gauge.
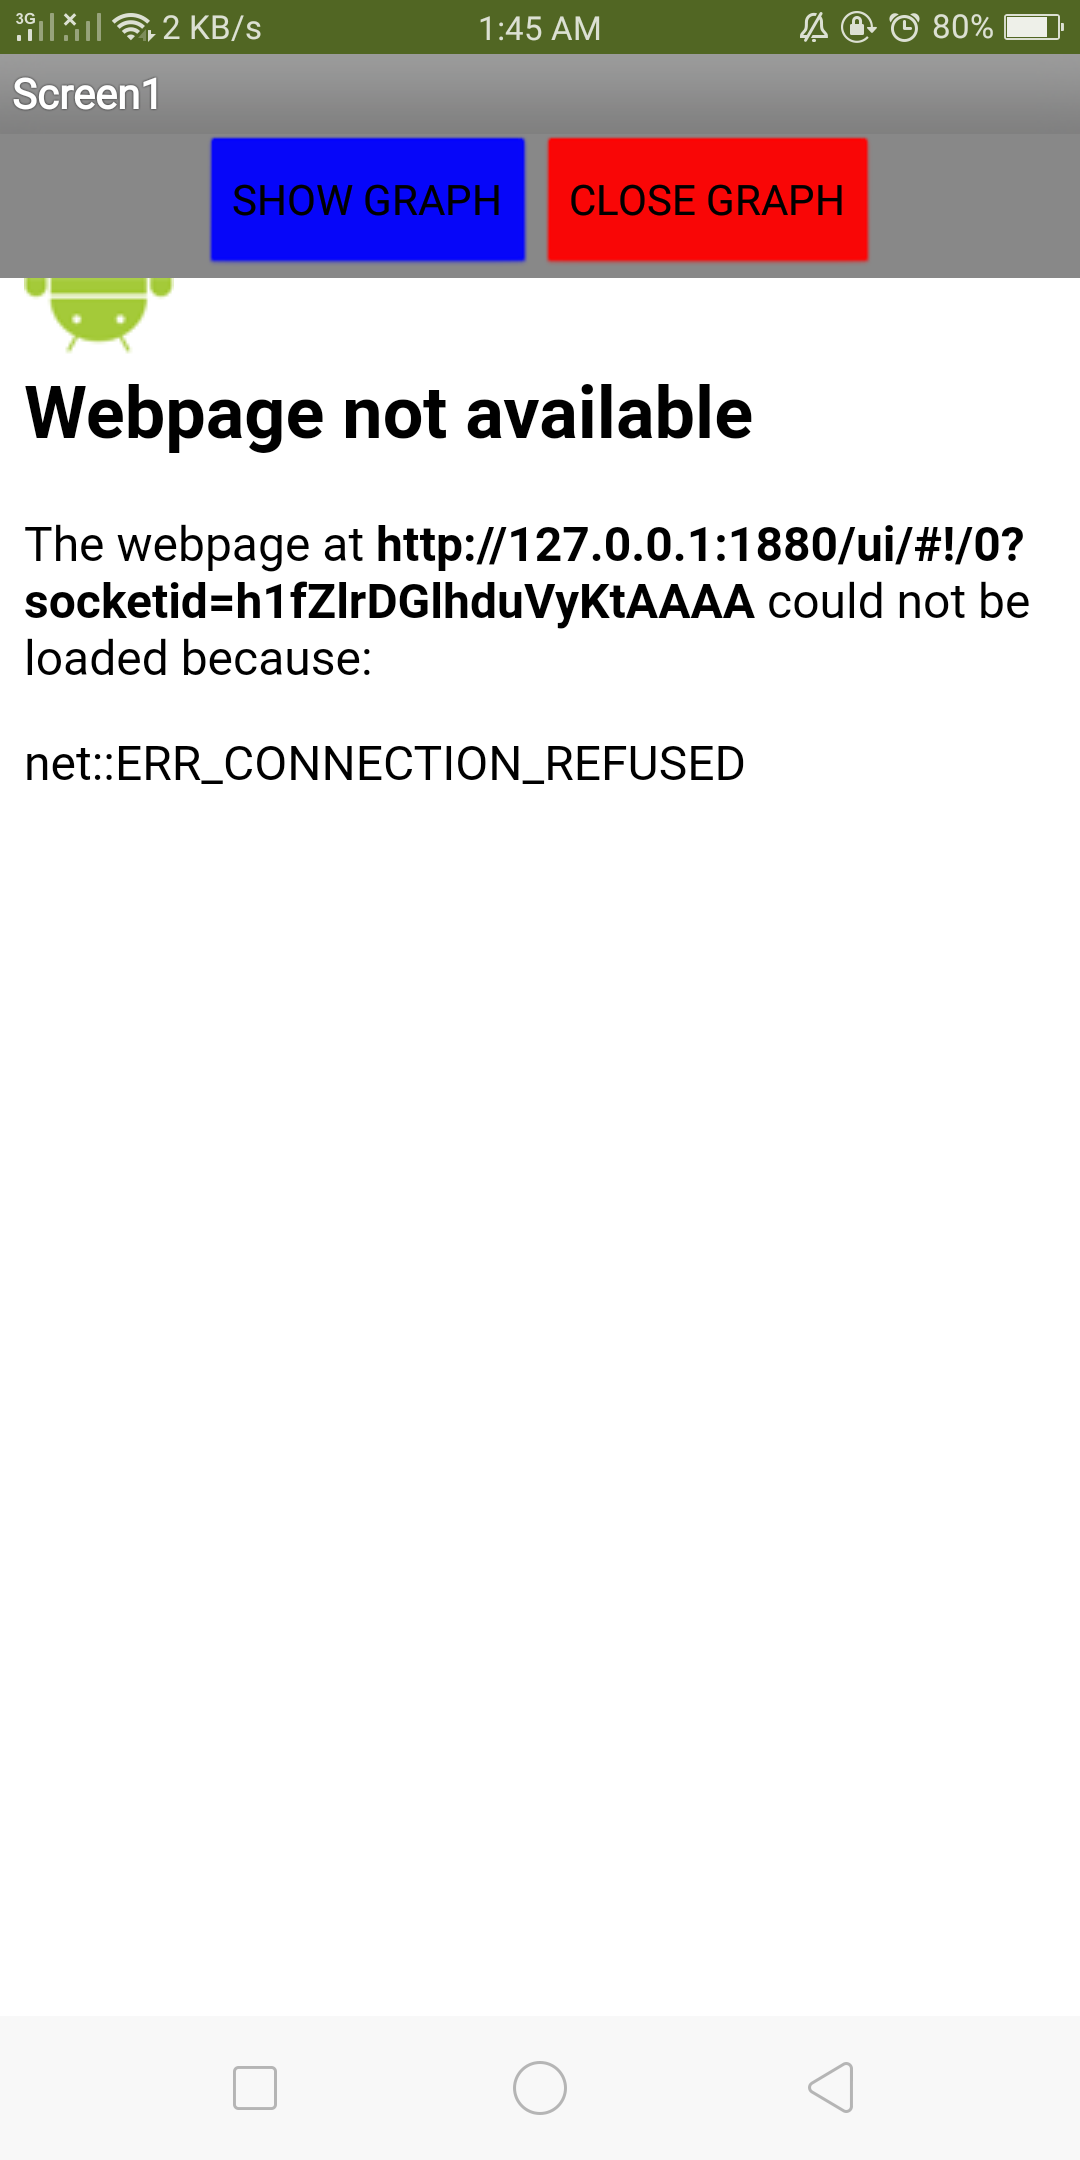
so i concluded that we can show pages from website ,however i guess the node-red dashboard is private connection and cannot be shown ,the error as below:
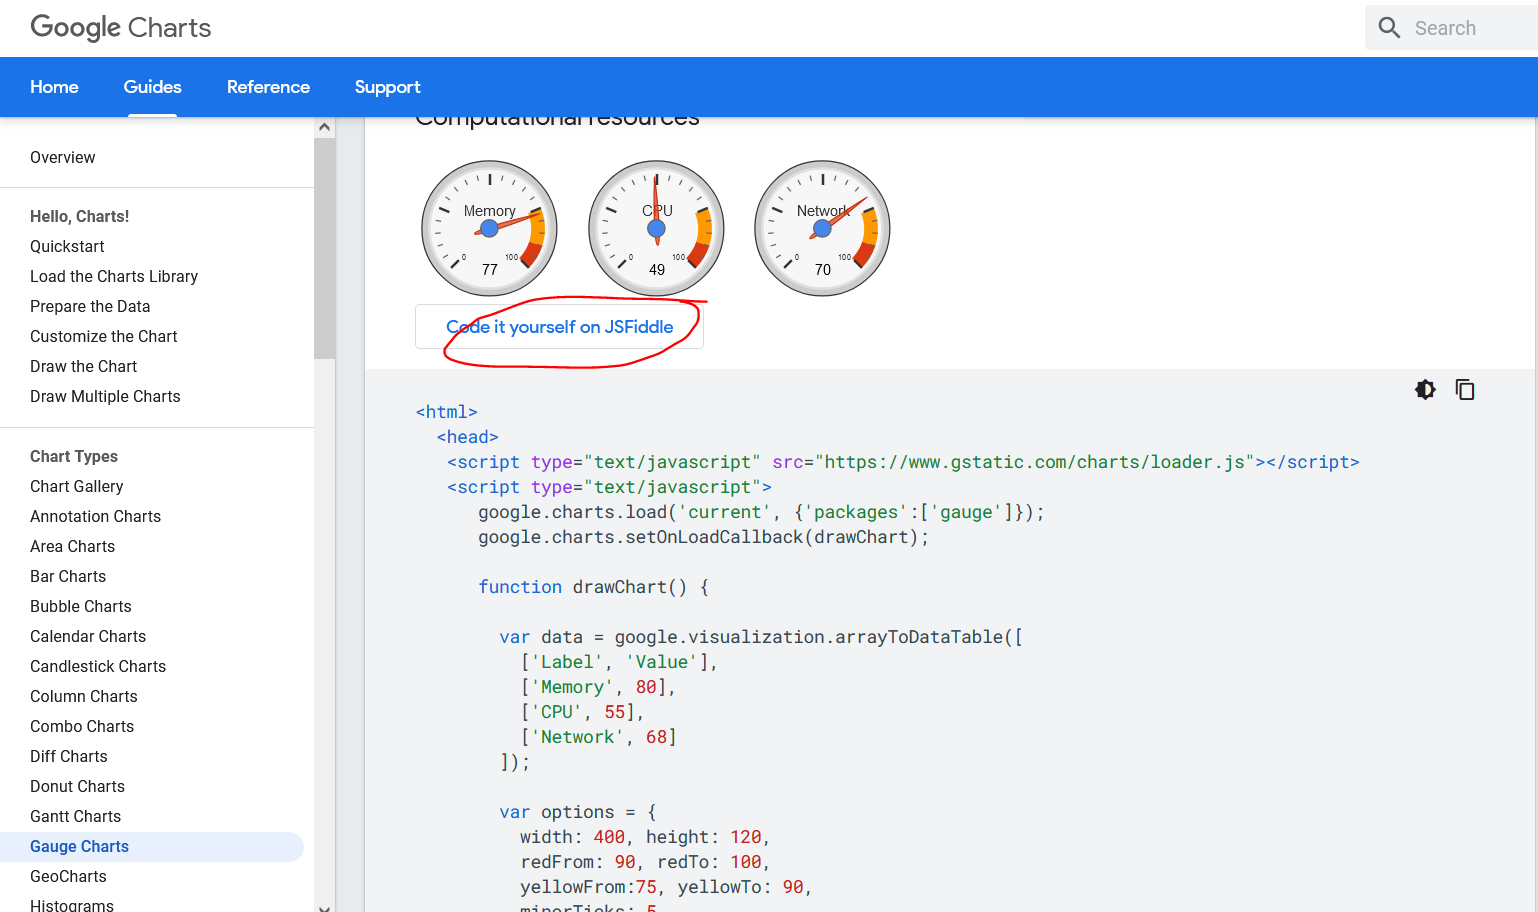
so then i did read about thinkspeak but its not suitable as it has restriction of 3 million data per year...my data (3000 data/minute) which means it will only support about 1000 minutes before reach 3M data.so the option available is google chart which has no restriction( i find its extension here in forum)
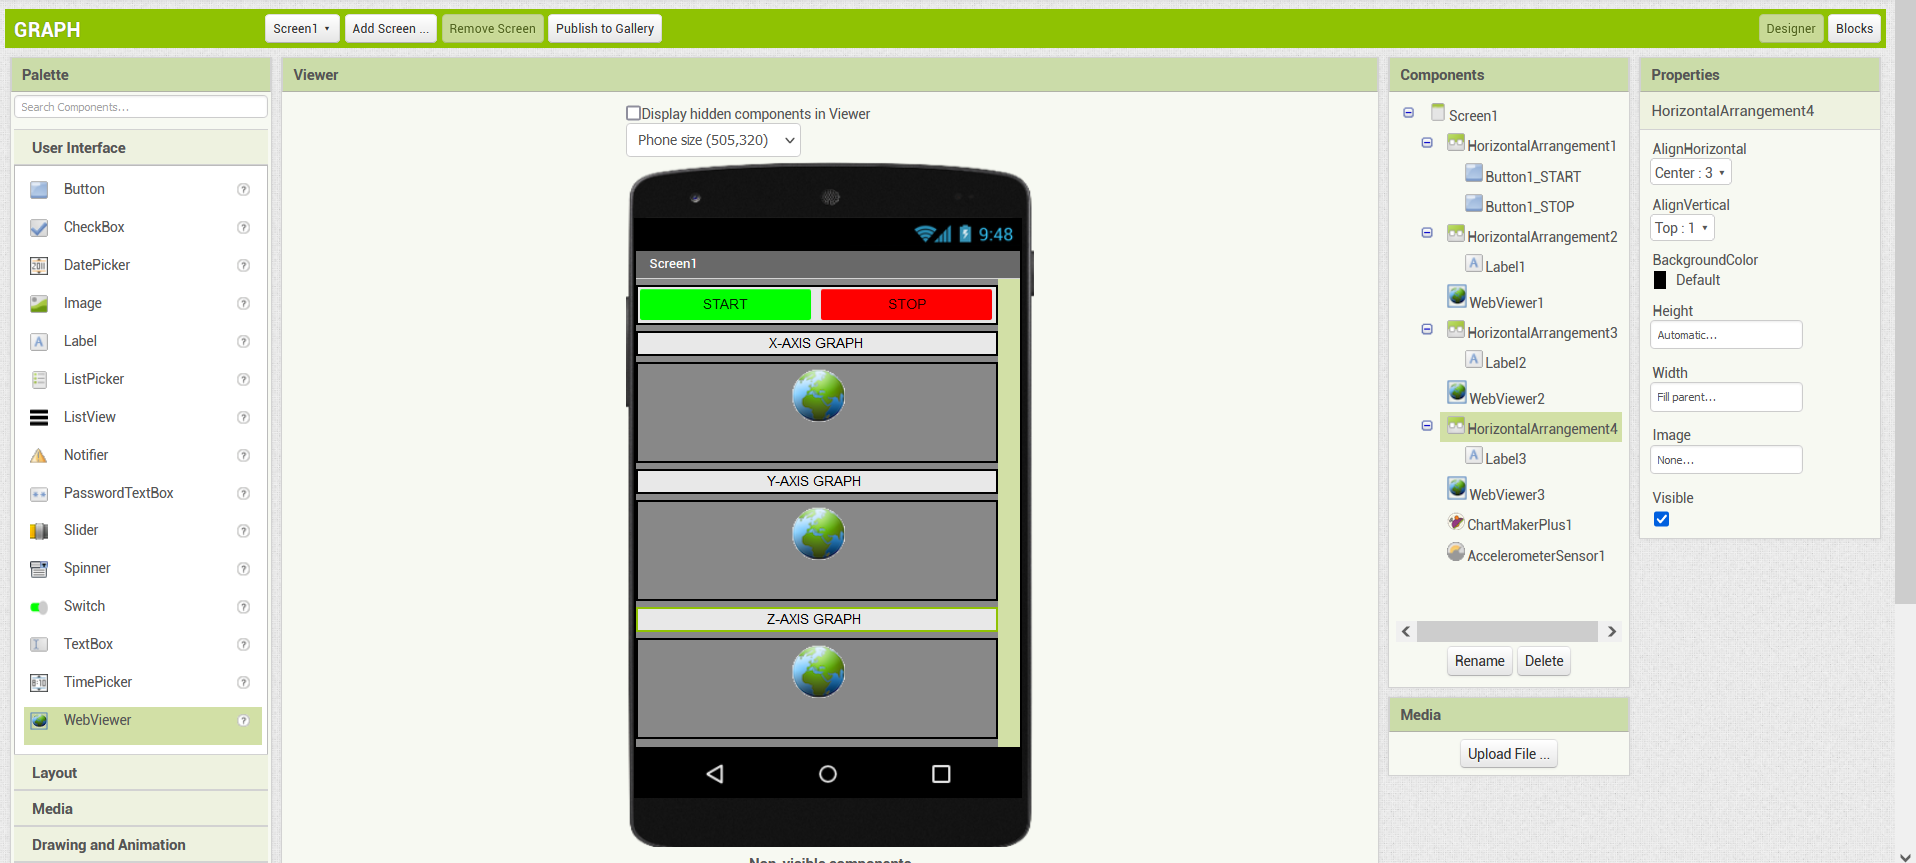
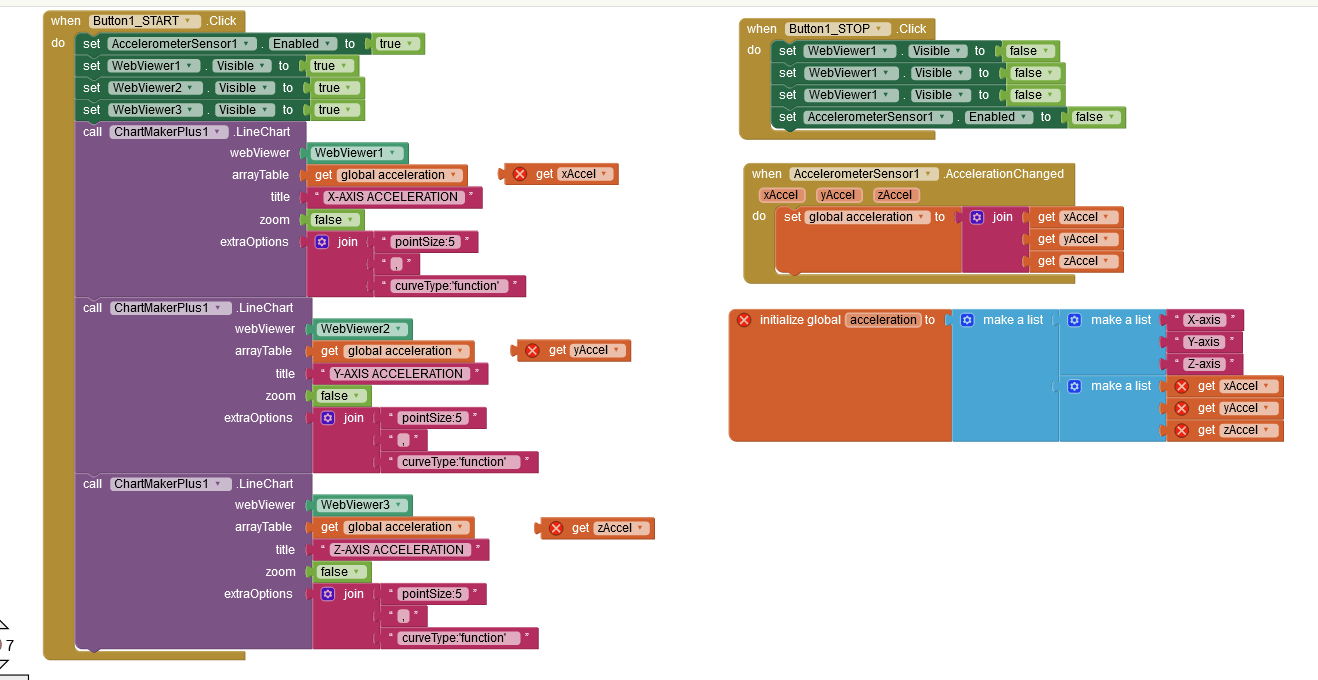
thus i decided to go with line chart via chartmaker plus extension created by @TIMAI2
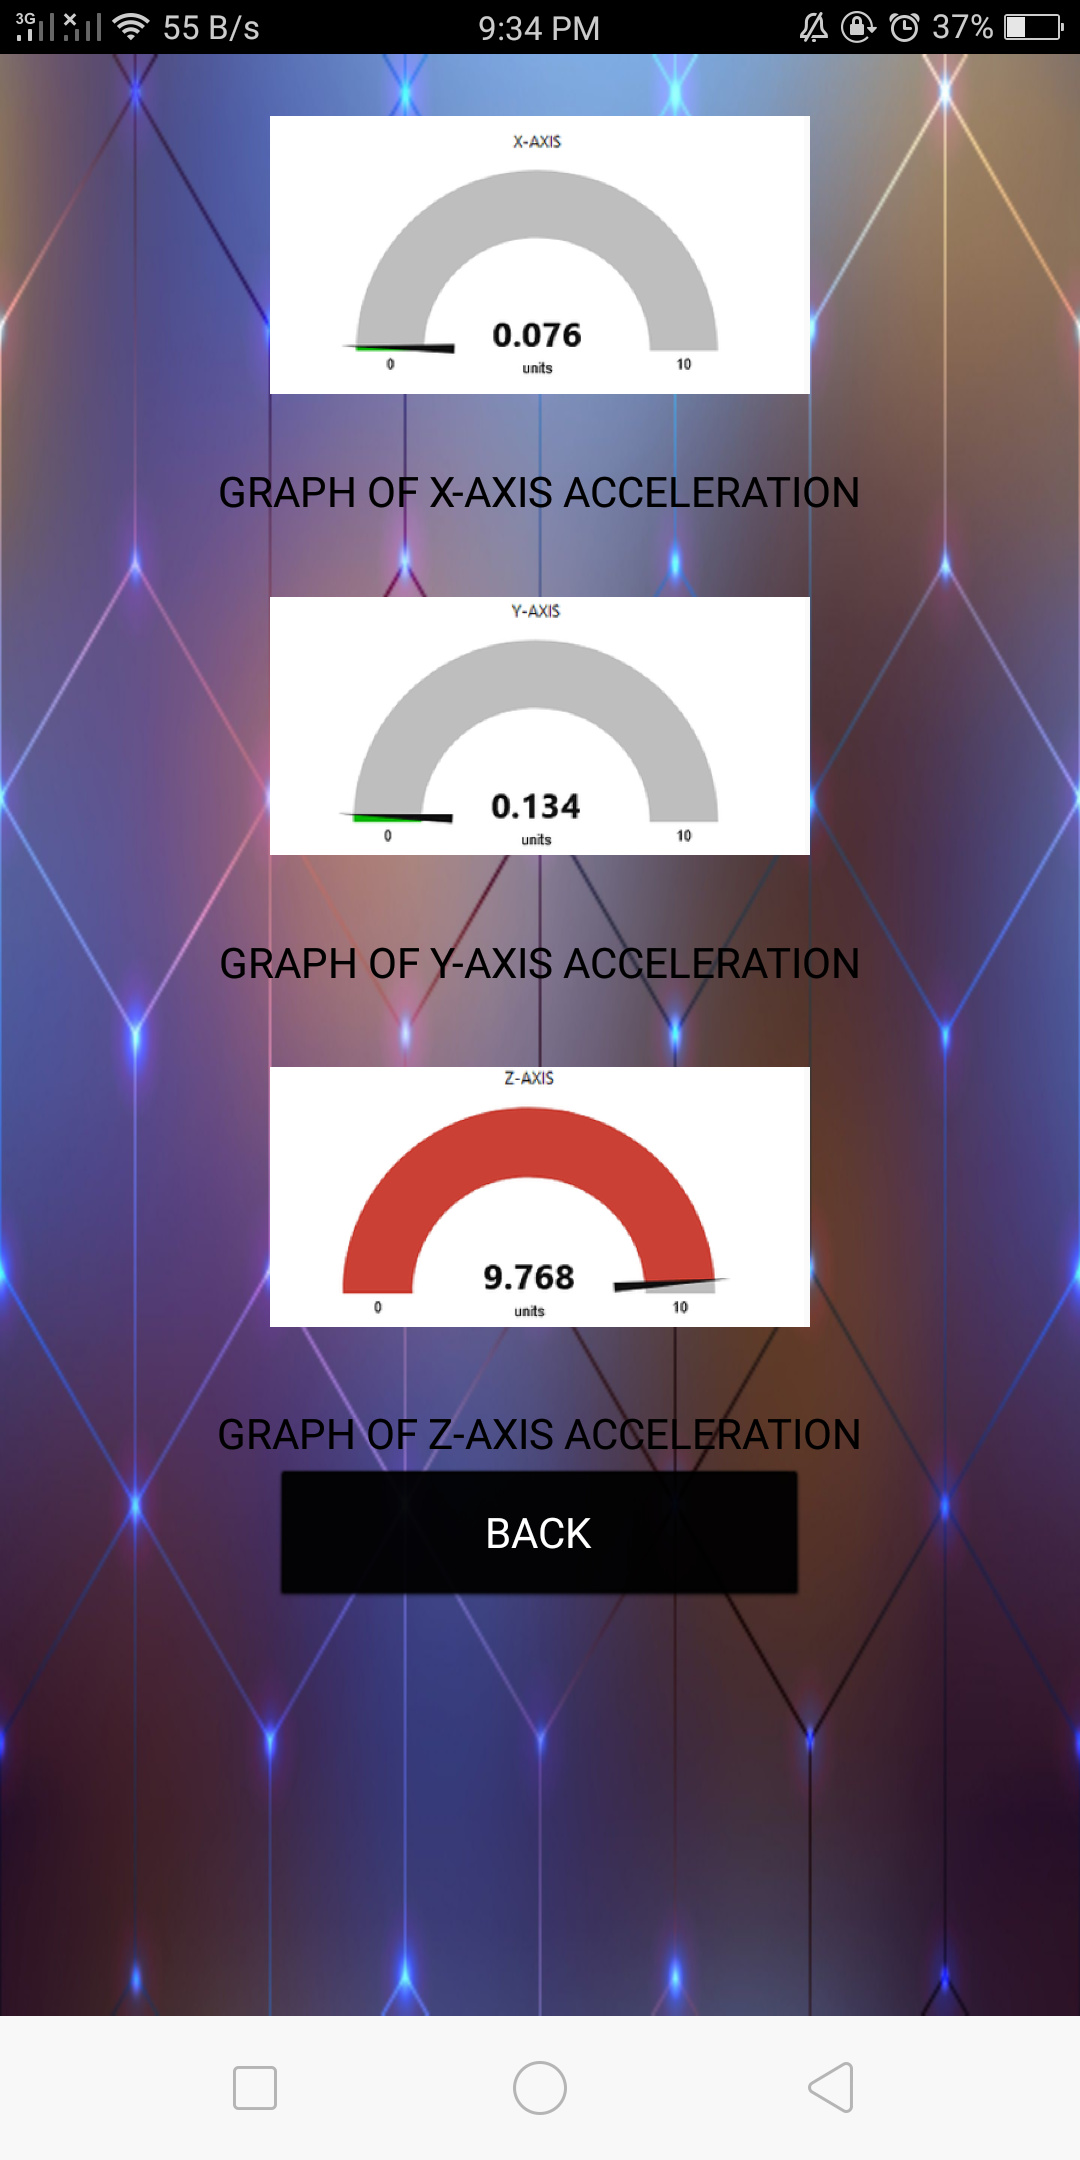
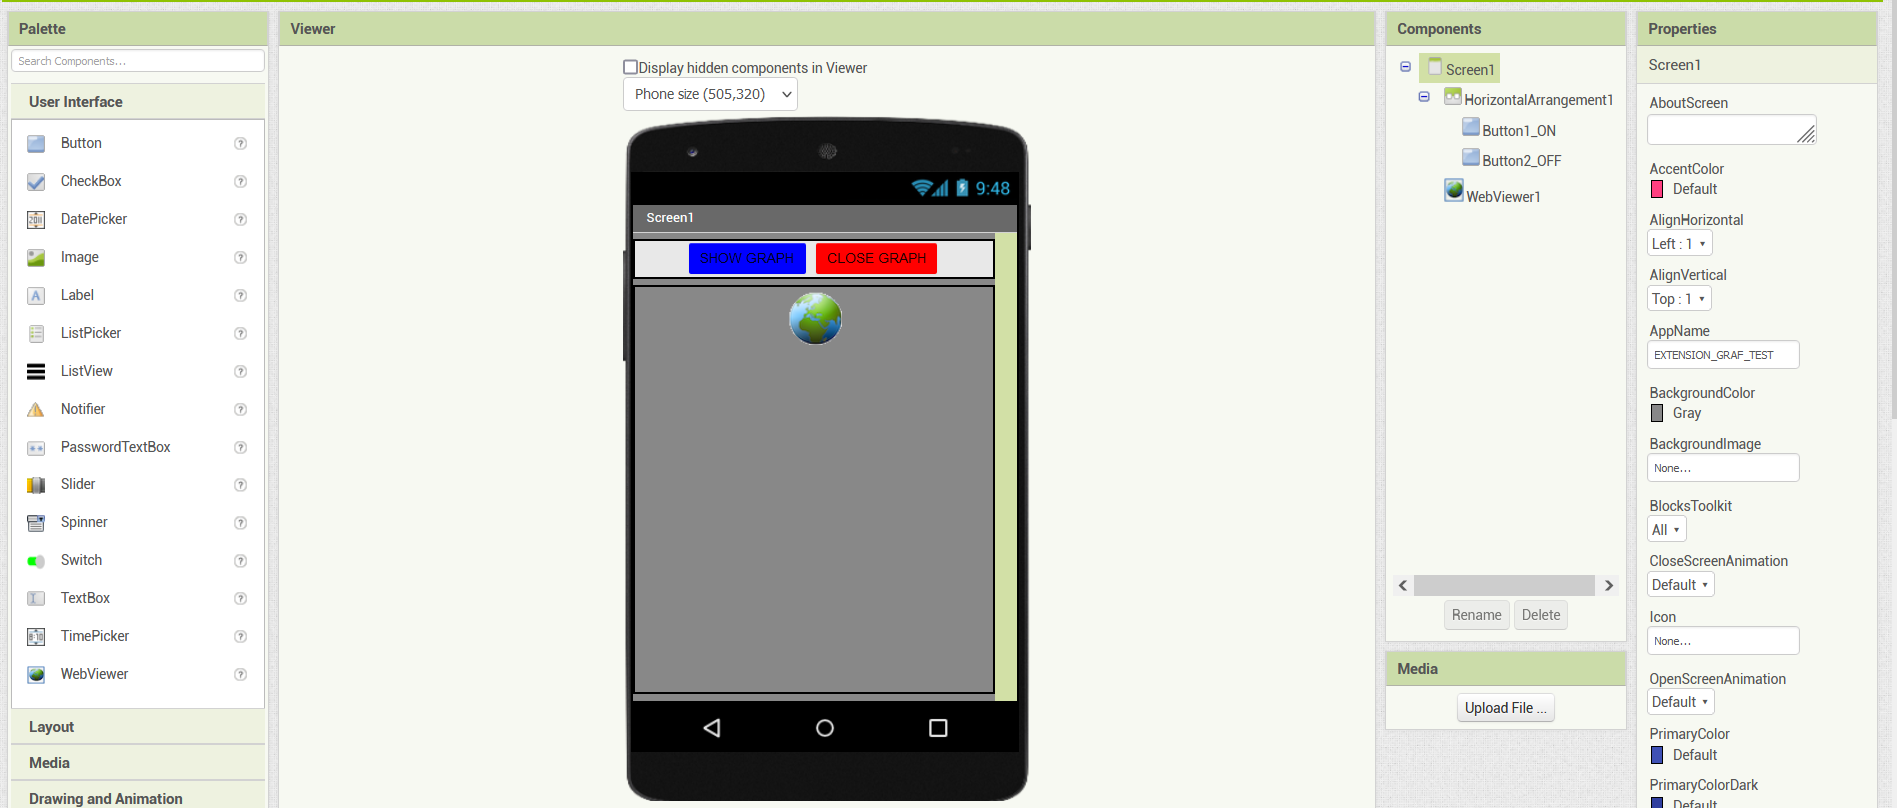
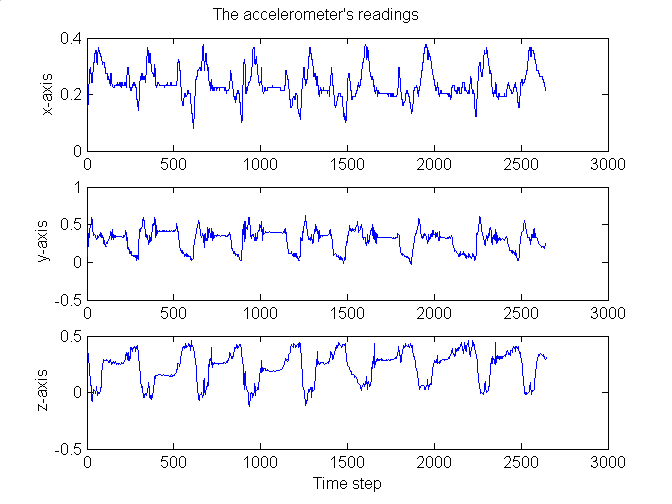
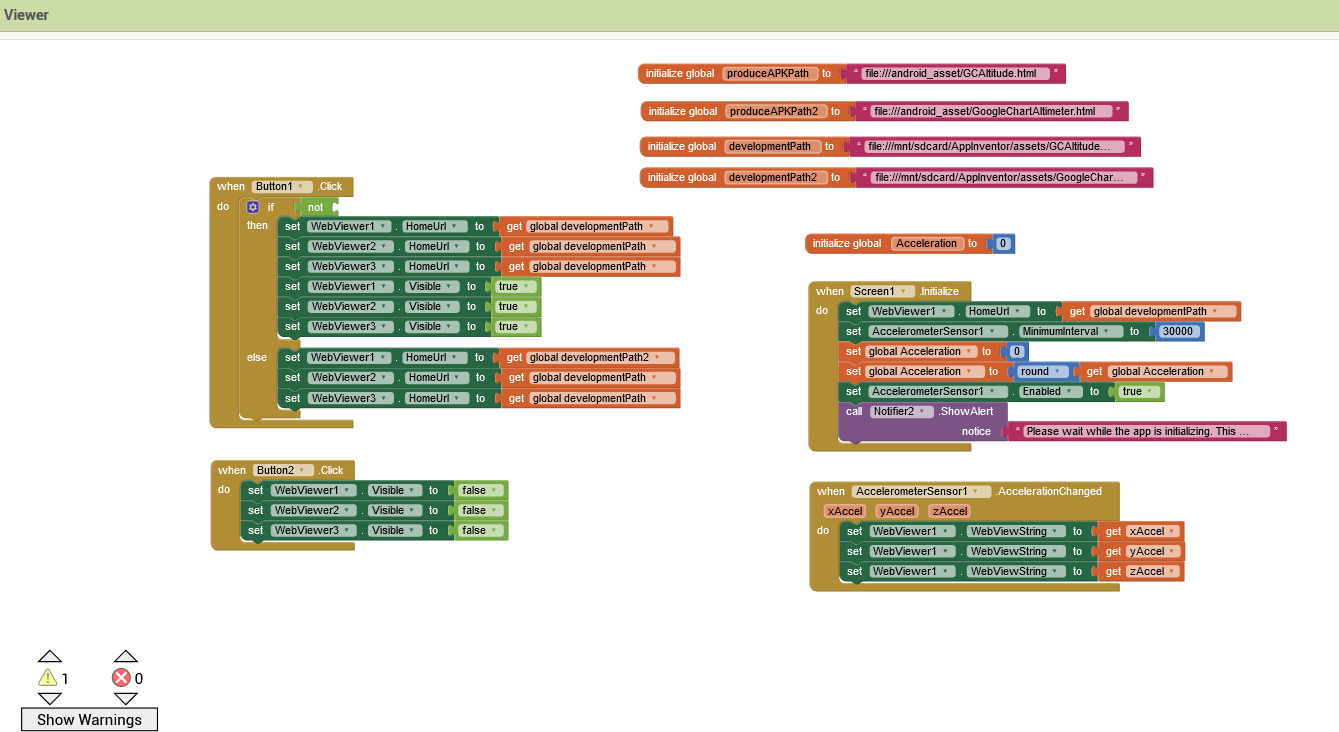
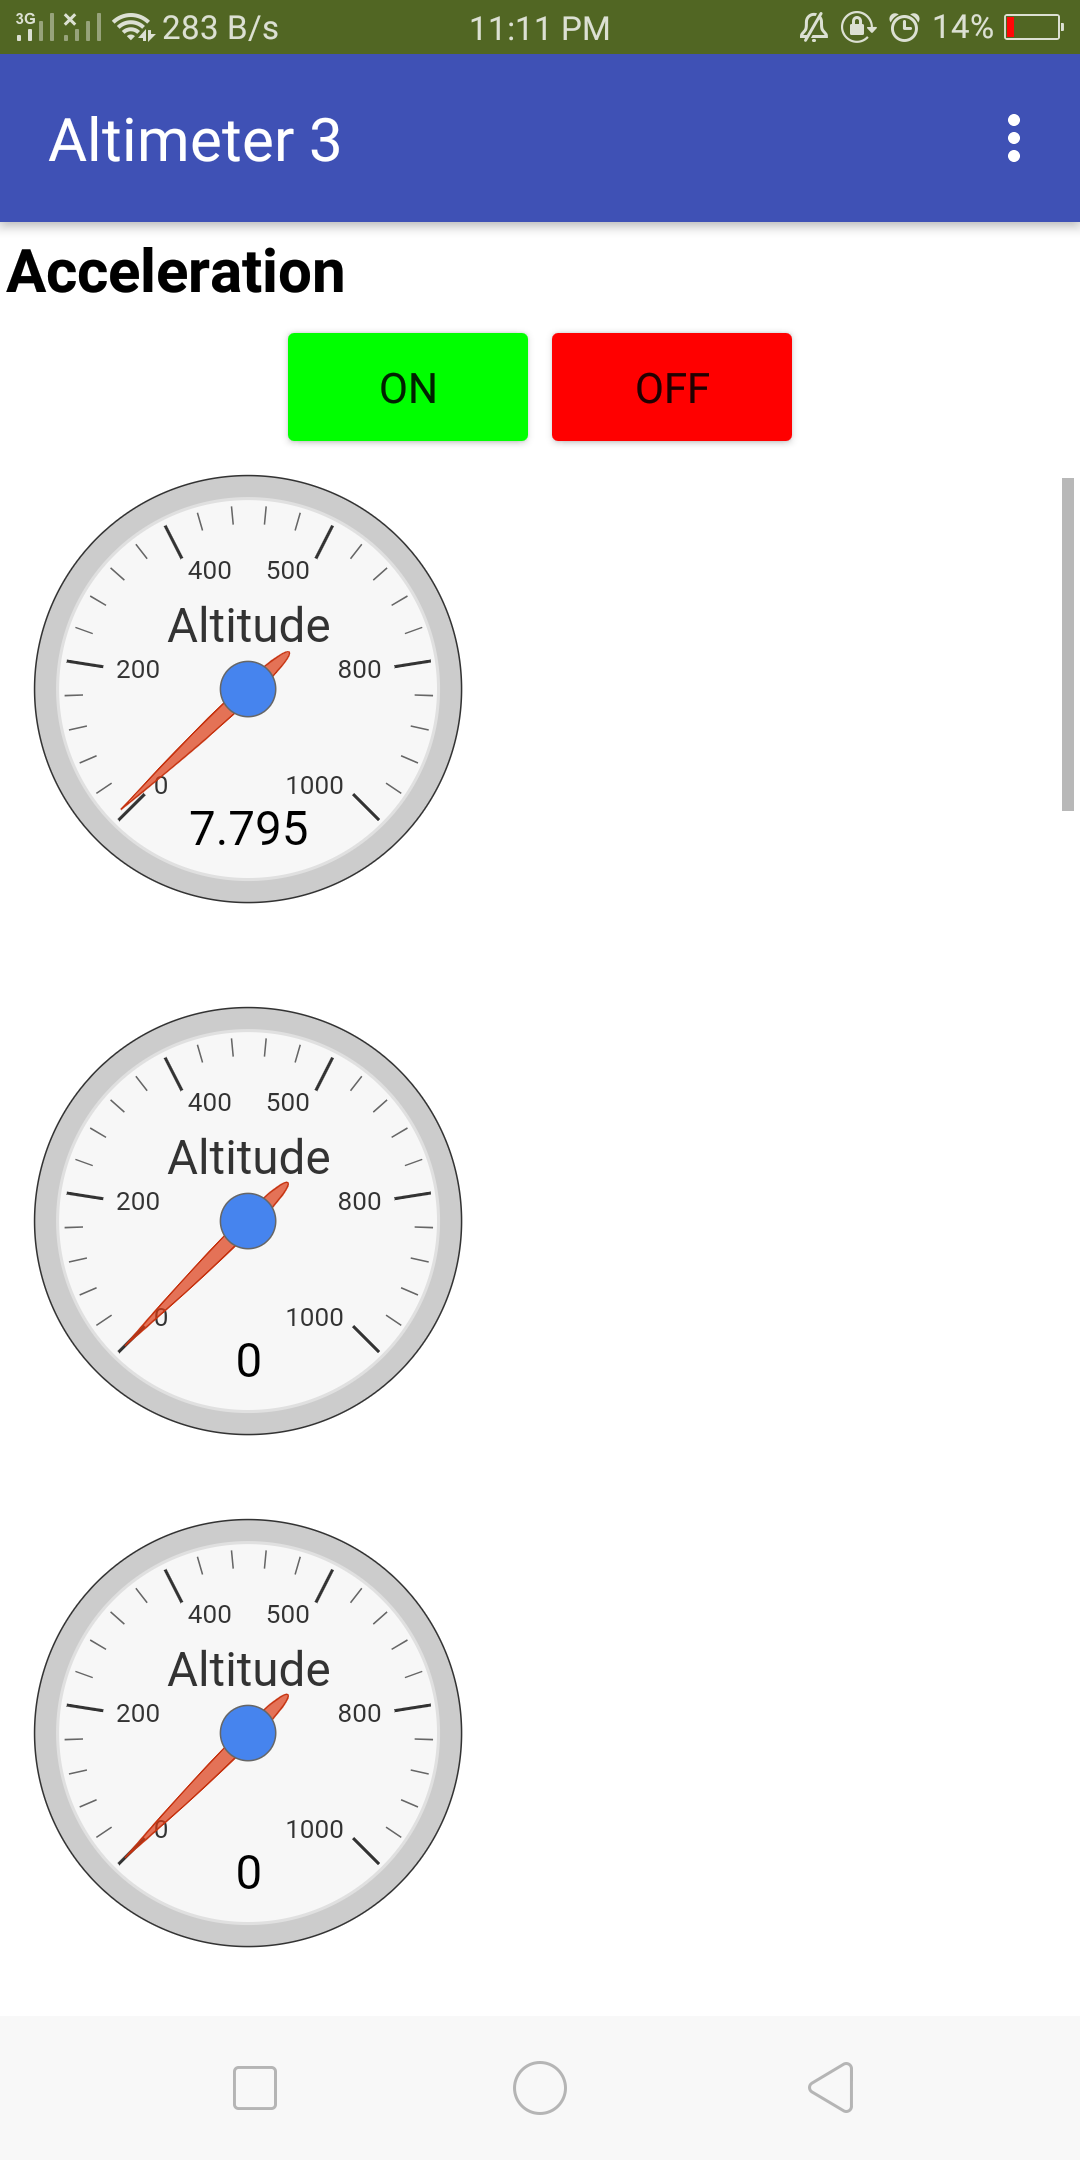
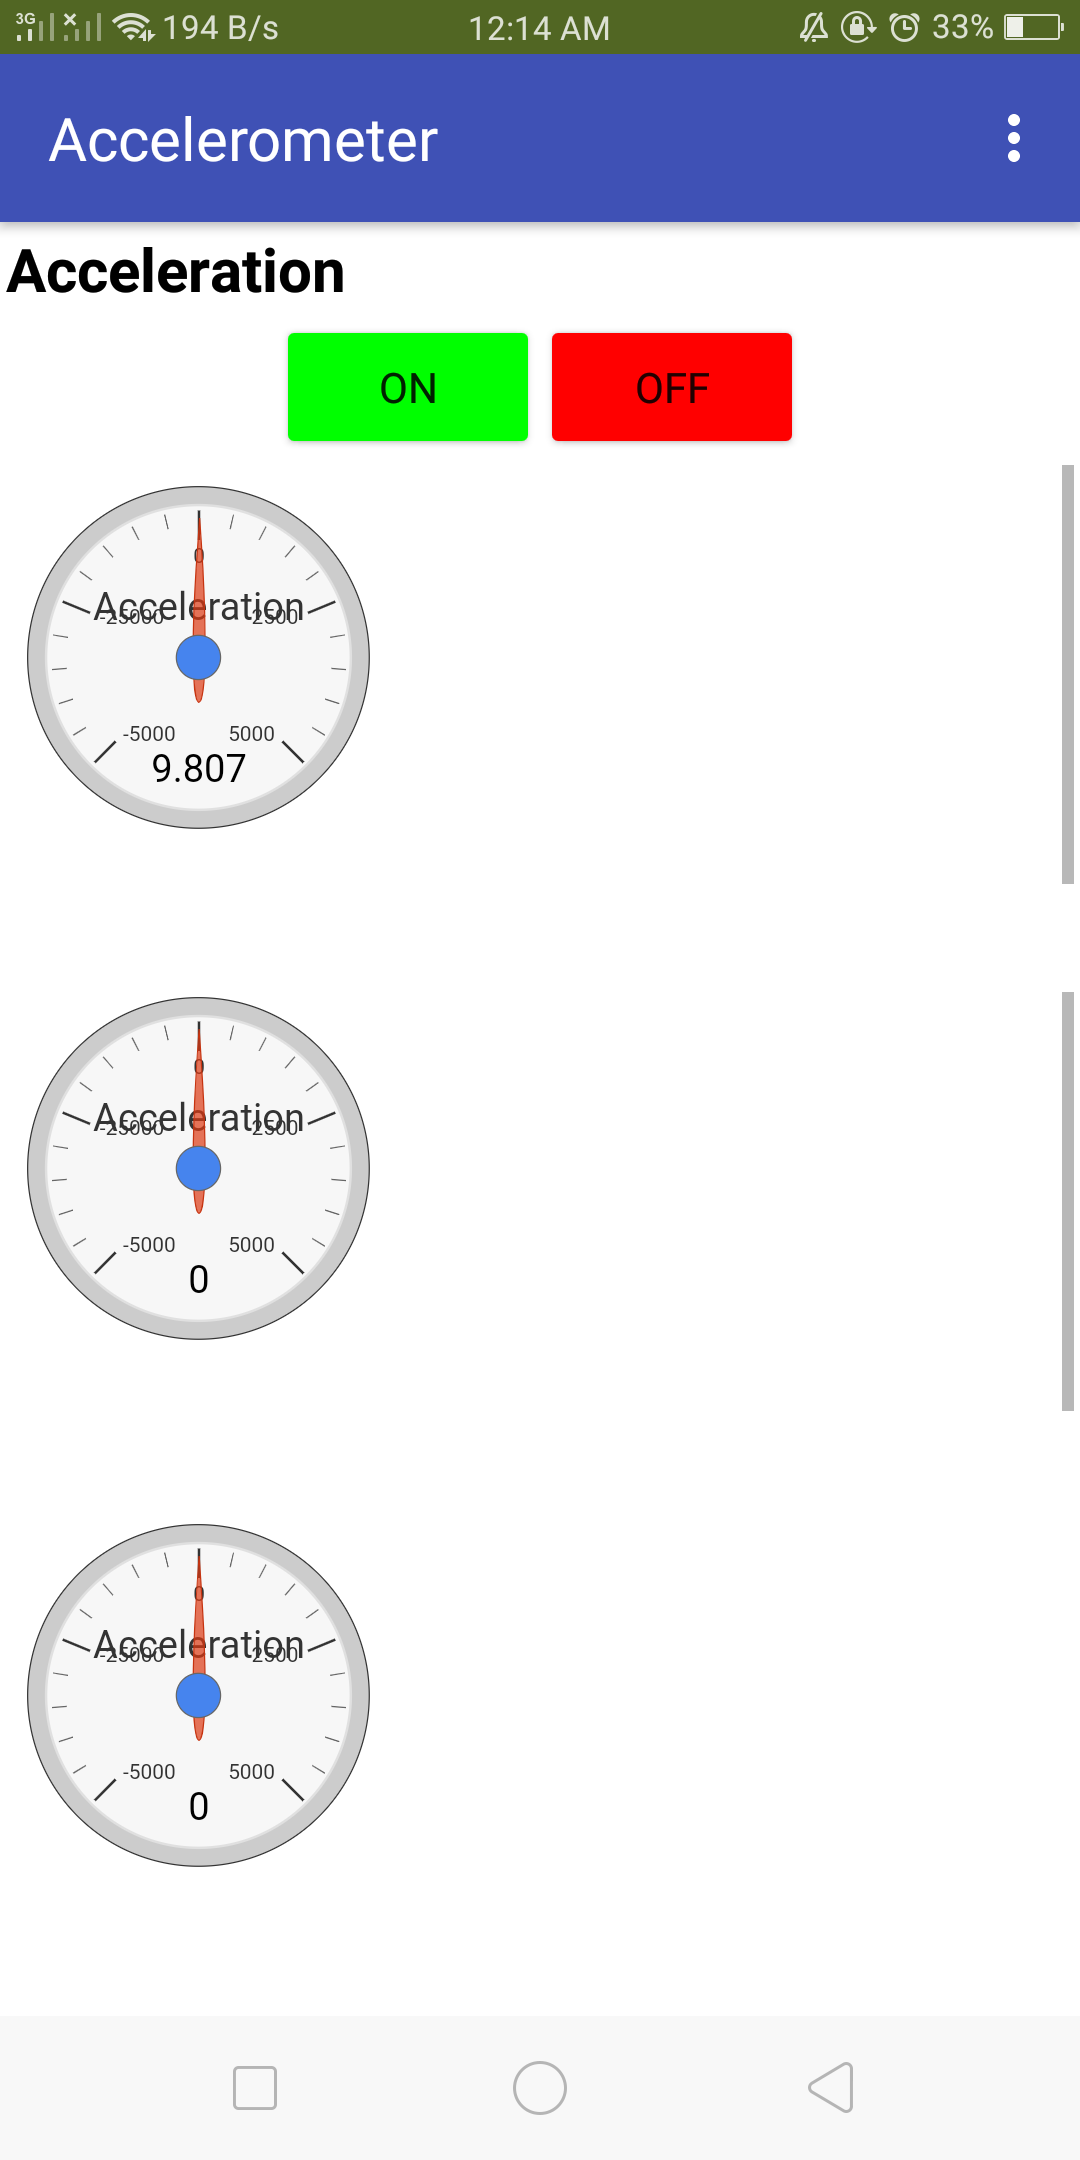
the intention is when click start button graph will produce real-time value from acceleration sensor for X-axis,Y-axis and Z-axis and stop when clicked on stop button.
Anyone who know how to solve this please help, thanks alot
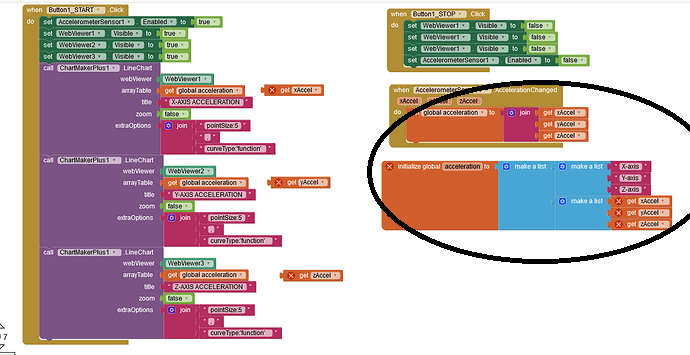
You are not building up the lists properly that your graphs need as input.
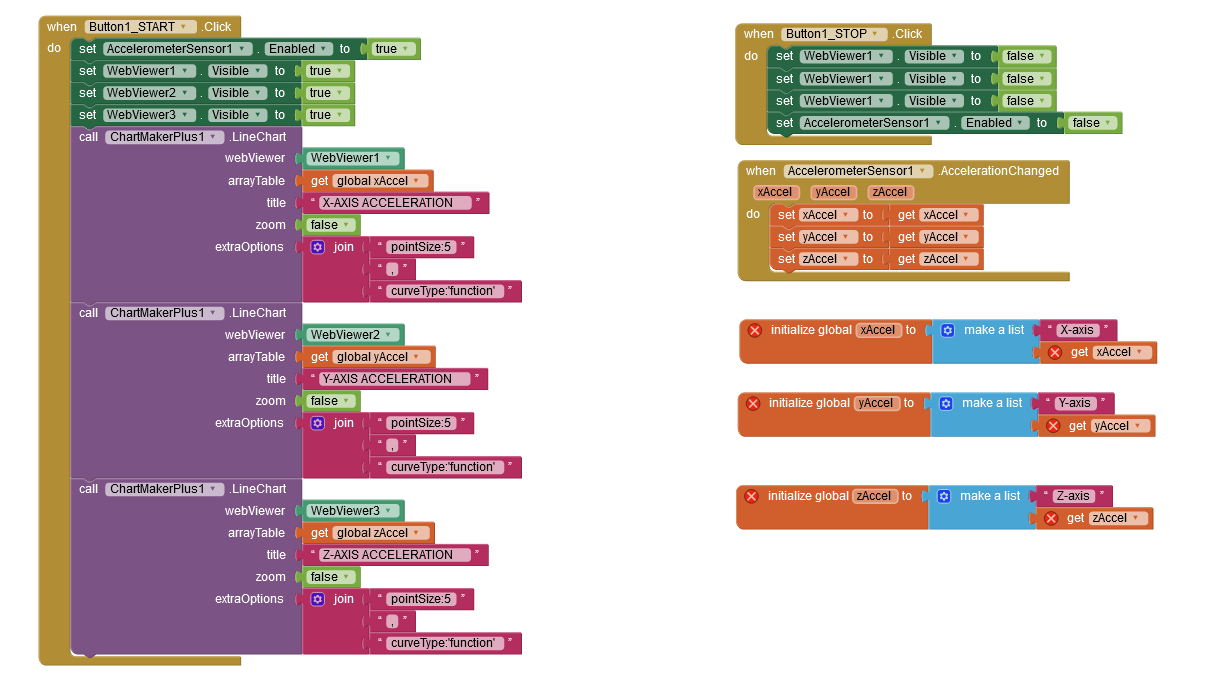
If you want 3 separate graphs, make 3 separate lists, and use the add item block for each value to the appropriate list each time you get new readings.
Check with your graph provider what they need for input, if it is one dimensional versus two dimensional.
i did check out this, i will try to do it,,last time im stuck due to set ImageSprite ,thanks ,,i will try and post here the result/question after i retry it.
First do the tutorial, make sure it the aia runs then save a copy. Then swap the LocationSensor LocationChanged with the Accelerometer.AccelerationChanged. Try some Blocks. If you get stuck you'll get some help. Be aware, parts of this are complicated but not difficult.
thanks alot for the info, im not so familiar with the coding as my background does not relate,but i love learning new knowledge and will look at it and try it untill i success to make it!
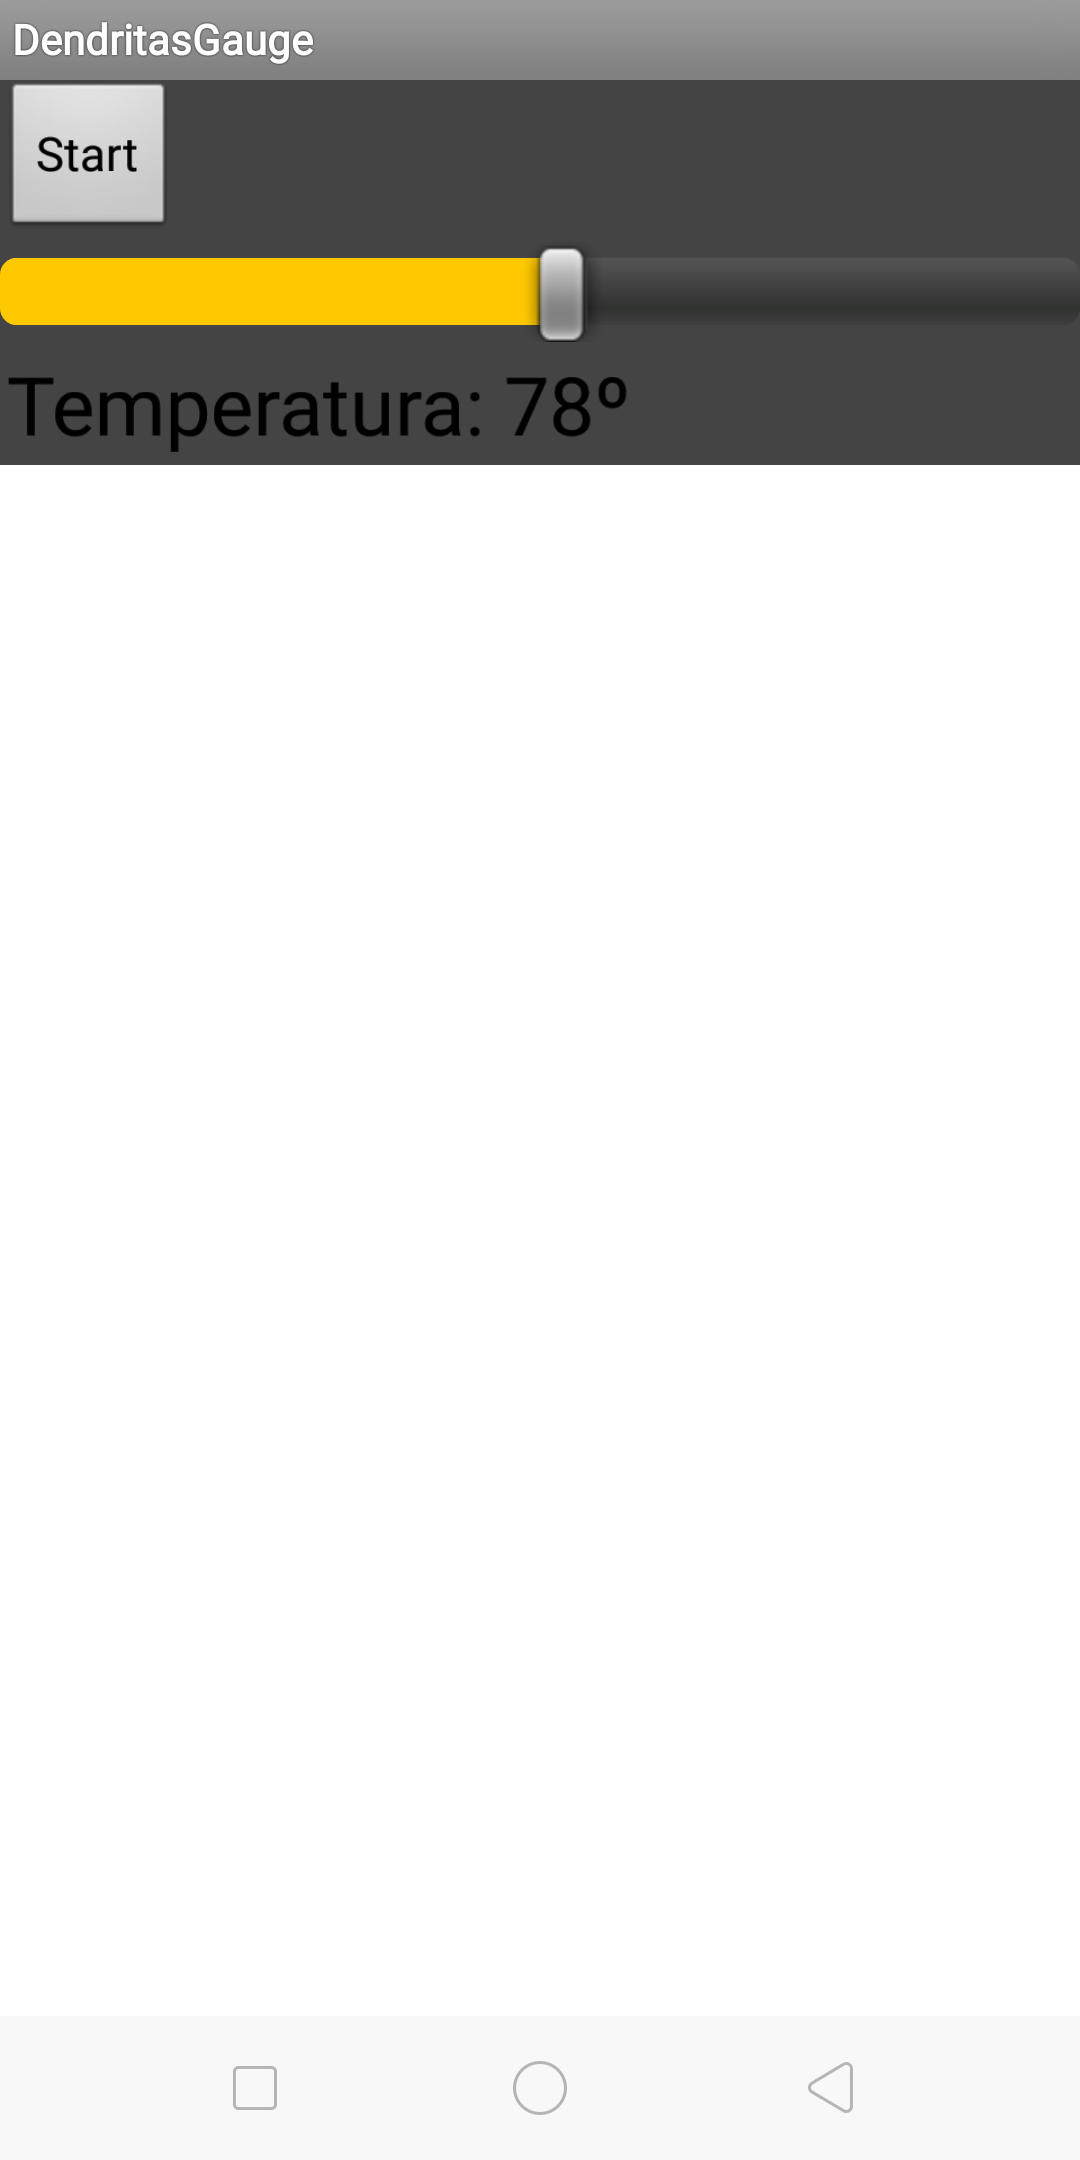
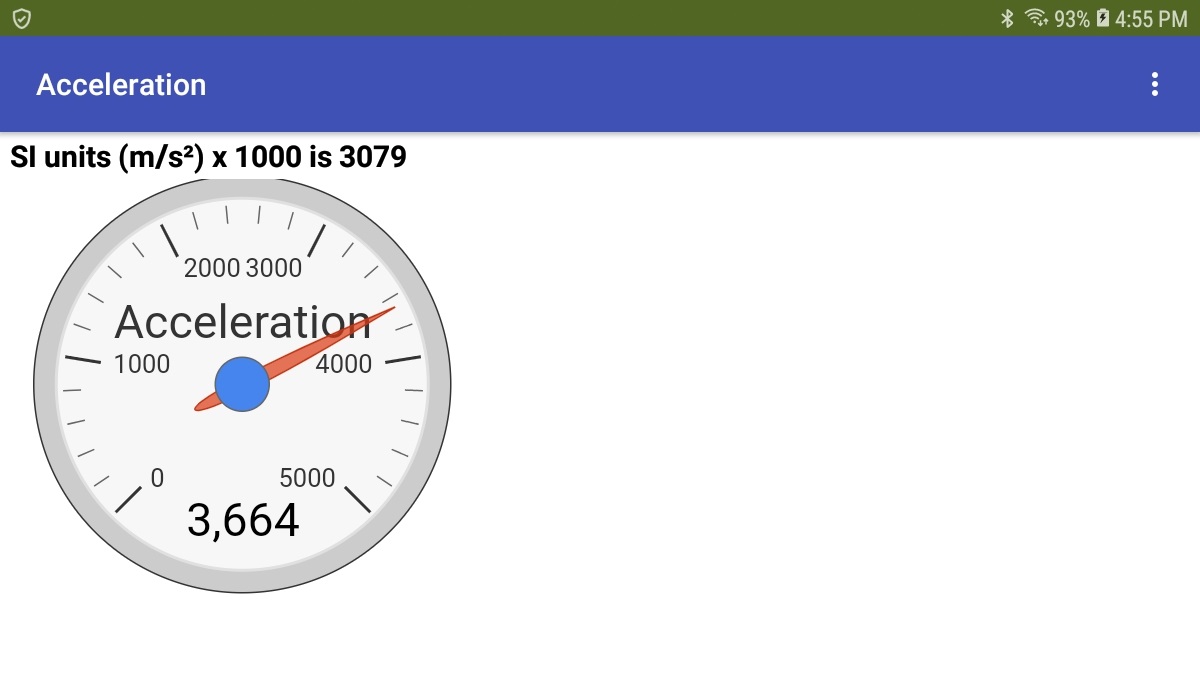
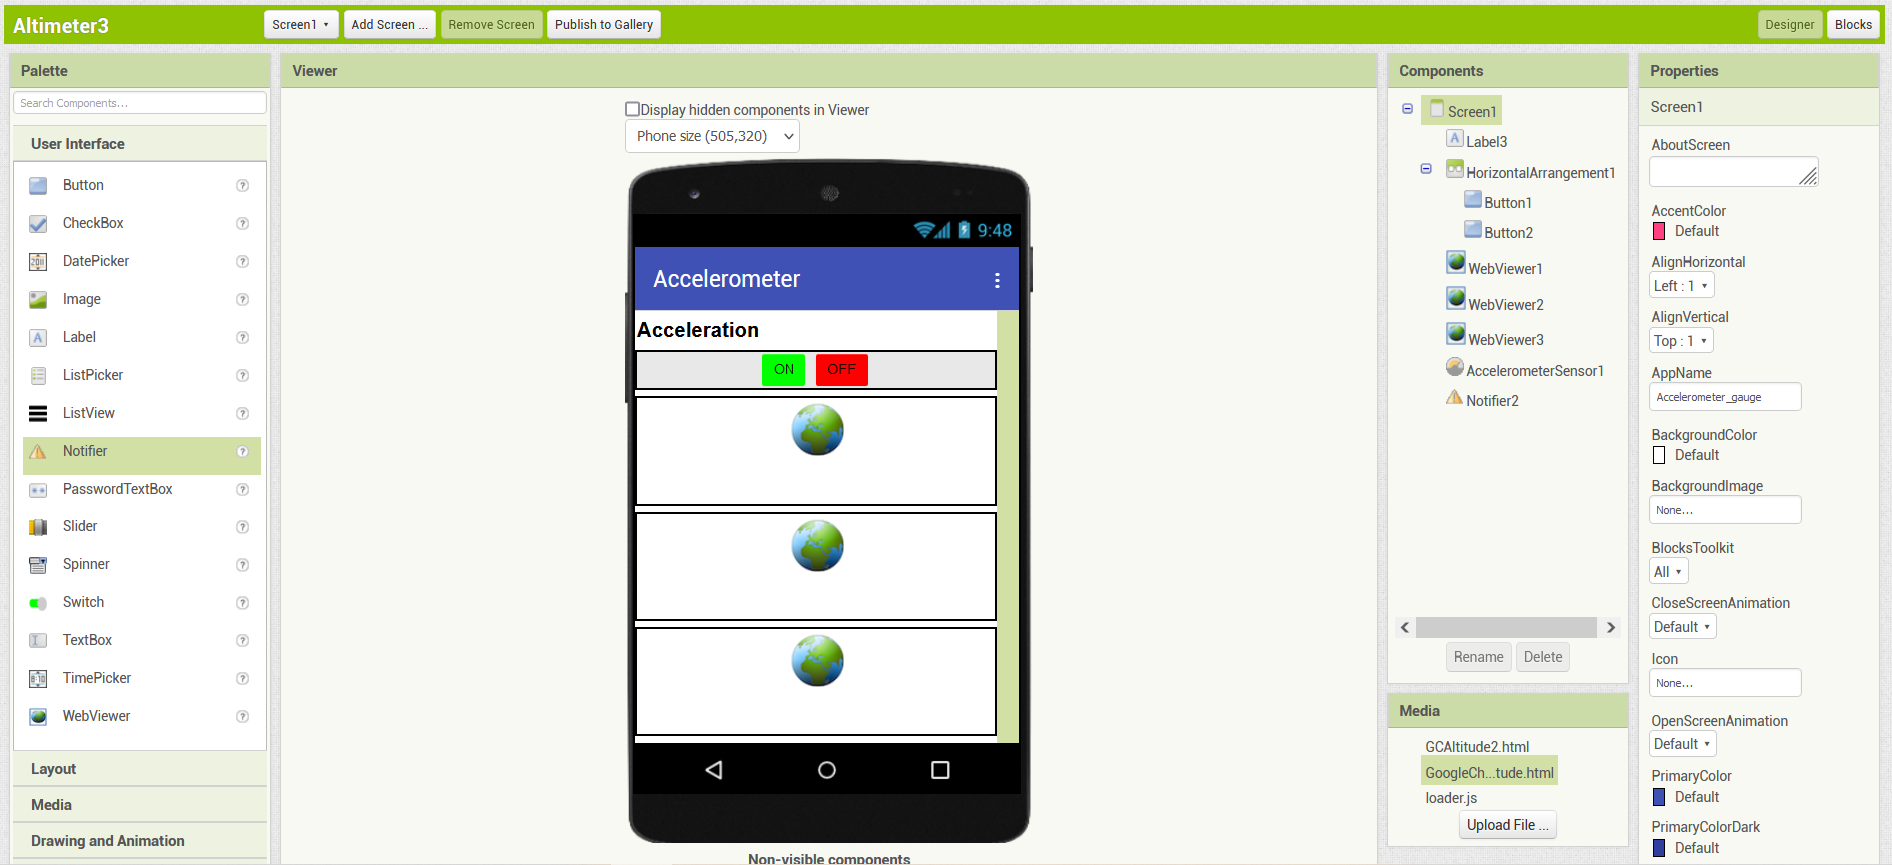
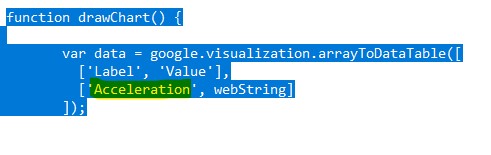
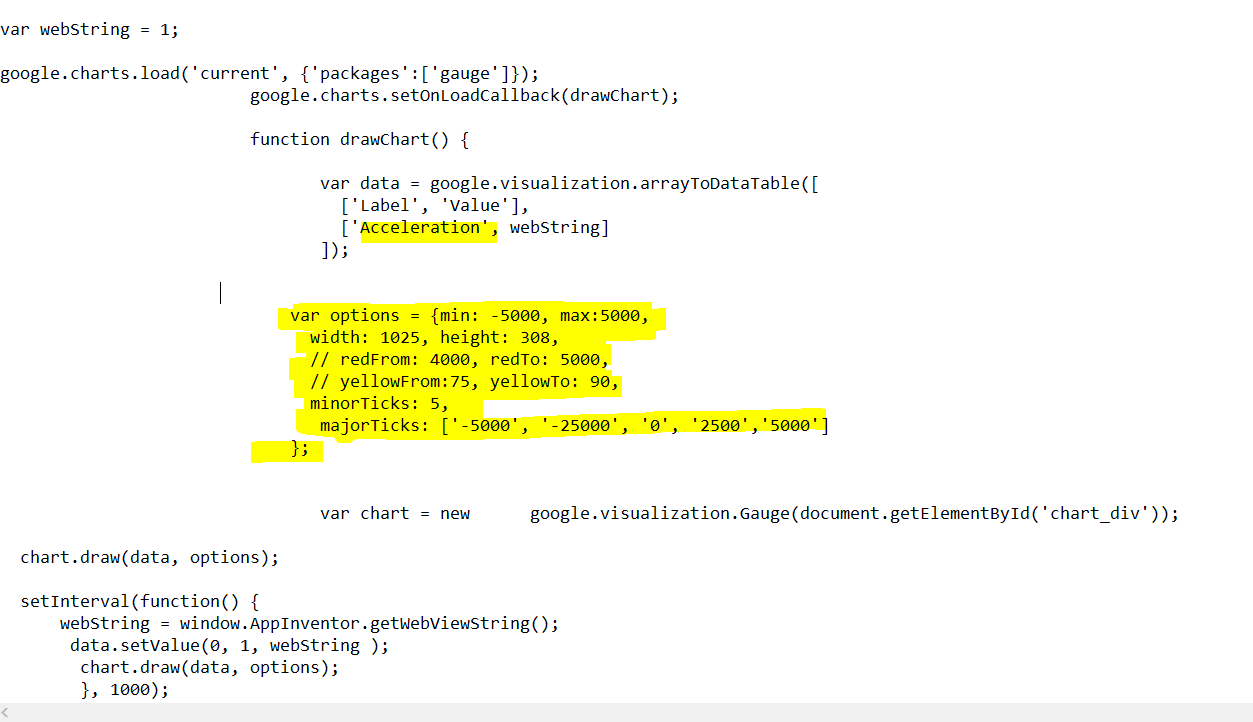
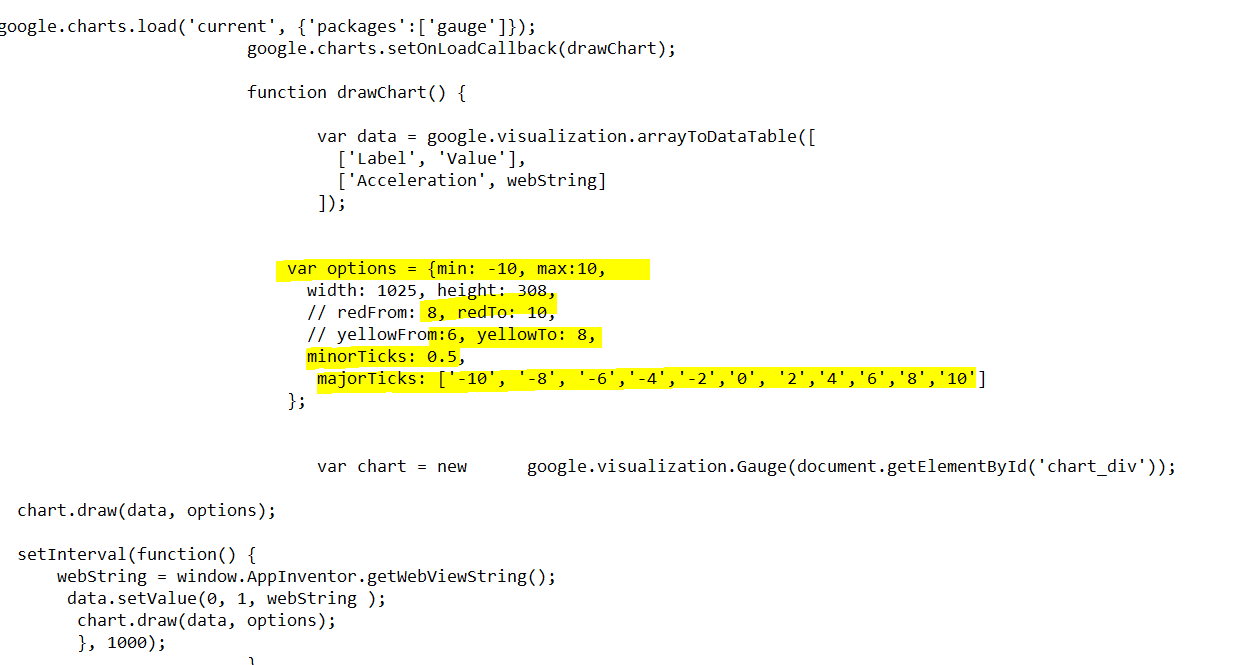
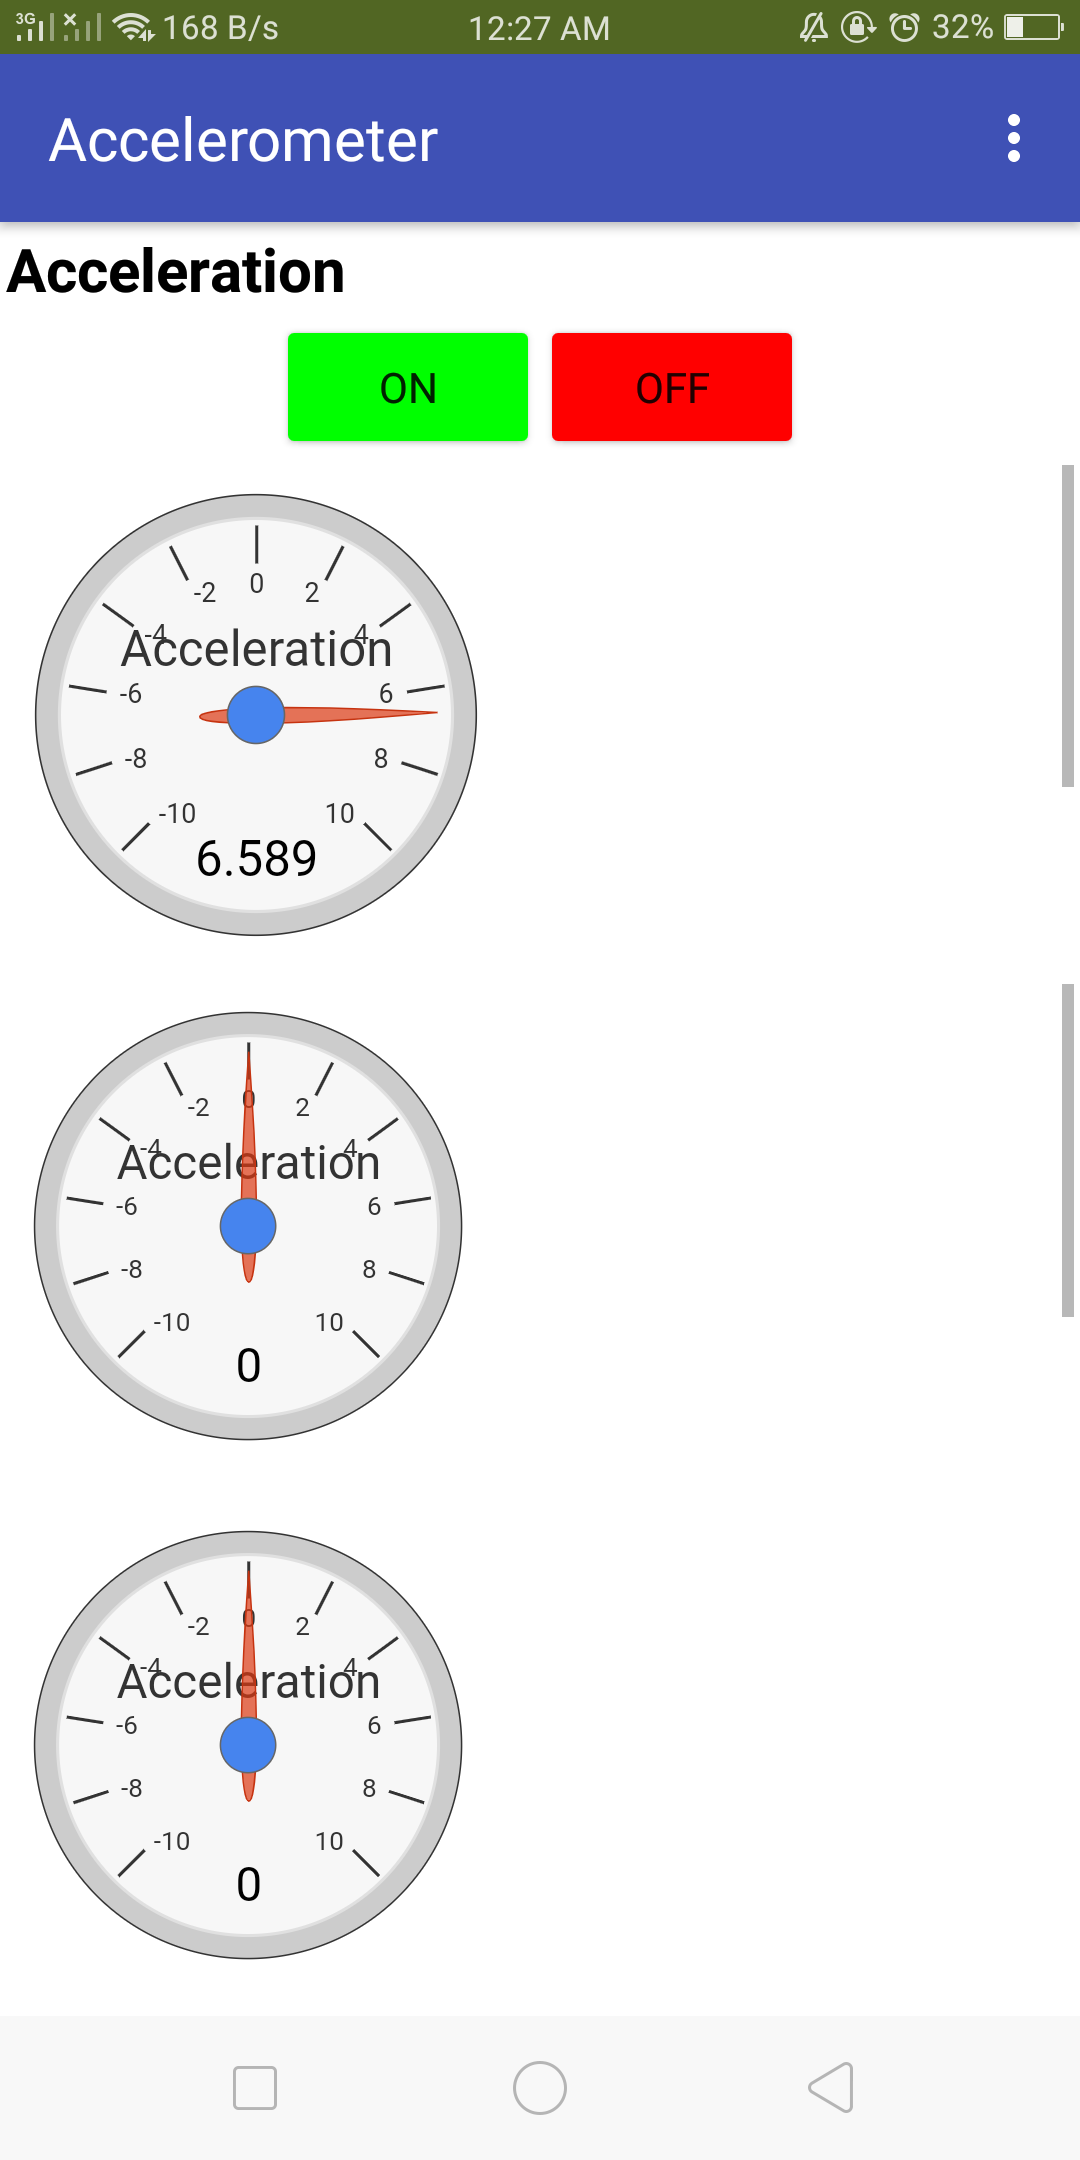
i did mange to make it, but i realize that the minor tick disappear and the colour/color does not appear as red(8 to 10) or yellow (6 to 8) lastly the webview 1(first accelerometer) function not the other 2