Wow!!!
Small question: google charts has this script:
"....com/charts/loader.js"
Is this loader.js imbedded in your extension code so that an internet connection is not required?
I guess so because if I disable connection, the chart is still showing.
... maybe it is in the cache? (I don't want to delete my data to find out)
No, loader.js is on the server side, it cannot be loaded client side, therefore an internet connection is required to build a google chart.
Thanks!
Now I'm stuck on trying to get a line break in my tooltip:
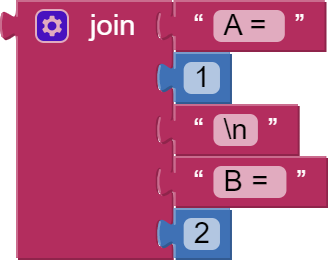
I also tried in the extraOptions:

But nothing worked, only no chart when "\n" or when "< br >" I get it literally in the text of the tooltip.
It is tricky, but can be done.
- in extraOptions add

- In your data, in the "header" list, add another data column with this(for the tooltips data):
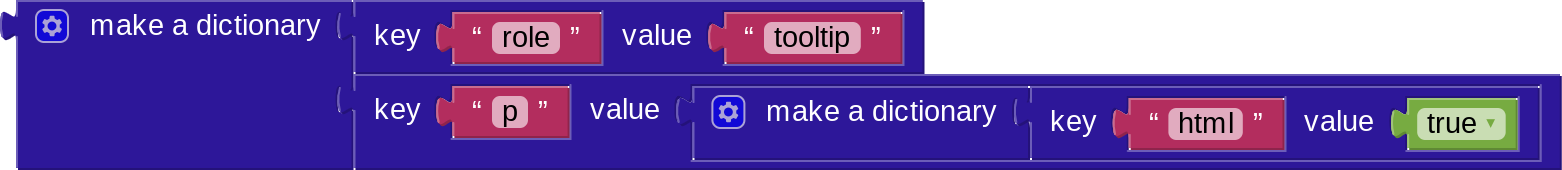
-
Add another item for each tooltip in your data.
-
Use
<br>for line returns
@TIMAI2
Would it be possible to embed this script in the extension so that no internet connection is needed?
Or would you consider posting your last java file so that we can add the script and compilate the extension for ourselves?
Google Charts requires an internet connection, you cannot install the loader.js locally.
I already advised you of this above:
The AI2 Chart component works locally, but is not as fully featured....
That's a pity.
hello, thank you very much for that work
i am asking if i can make timeline chart with this extension the same like google time line charts
example from google docs..
==============================================================
google.charts.load('current', {'packages':['timeline']});
google.charts.setOnLoadCallback(drawChart);
function drawChart() {
  var data = google.visualization.arrayToDataTable([
    ['Activity', 'Start Time', 'End Time'],
    ['Sleep',
     new Date(2014, 10, 15, 0, 30),
     new Date(2014, 10, 15, 6, 30)],
    ['Eat Breakfast',
     new Date(2014, 10, 15, 6, 45),
     new Date(2014, 10, 15, 7)],
    ['Get Ready',
     new Date(2014, 10, 15, 7, 4),
     new Date(2014, 10, 15, 7, 30)],
    ['Commute To Work',
     new Date(2014, 10, 15, 7, 30),
     new Date(2014, 10, 15, 8, 30)],
    ['Work',
     new Date(2014, 10, 15, 8, 30),
     new Date(2014, 10, 15, 17)],
    ['Commute Home',
     new Date(2014, 10,  15, 17),
     new Date(2014, 10,  15, 18)],
    ['Gym',
     new Date(2014, 10, 15, 18),
     new Date(2014, 10,  15, 18, 45)],
    ['Eat Dinner',
     new Date(2014, 10,  15, 19),
     new Date(2014, 10,  15, 20)],
    ['Get Ready For Bed',
     new Date(2014, 10,  15, 21),
     new Date(2014, 10,  15, 22)]
  ]);

  var options = {
    height: 450,
  };

  var chart = new google.visualization.Timeline(document.getElementById('chart_div'));

  chart.draw(data, options);
}
====================================================================
here the array of times is made like that ['Get Ready For Bed',
new Date(2014, 10, 15, 21),
new Date(2014, 10, 15, 22)]
is that mean to make the data line table should contain the word new Date ?
what will be the extra option i need to put
accully my data will be datetime for sensor that measures ph every 4 hours this data is saved in firebase database so it easy to get it formated as keys and values where the keys will be the time but should it be in
new Date(2014, 10, 15, 21)
this formate ?
You will have to use Google Charts directly for that, in a webviewer.
1 Like
Please do you have any examples for this ?
hi!
thank you a lot for made it! im using well.
i have a question,
how can i change font size of axis?
for example,
5
4
3
2
1
...1 2 3 4 5 6 7
these axis text font size (+title size). i cannot understand even if i read google chart tutorial..
can i insert into options or css part?
ps/ and zoom options is not working with "true"
+add
i found! e.g : fontSize:30
but still cannot zoom..
You do not say which chart you are making? (line/pie/bar etc. ?)
That said, for a bar chart, which includes vaxis options:
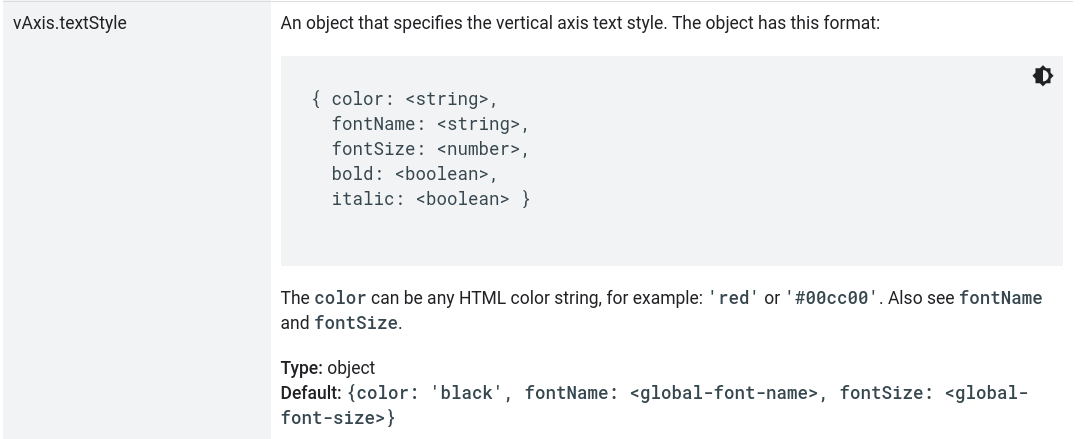
You would set this in options, not css
Hi
Good extension
Is there a way to keep for instance One Hour of data ? Or let's say 150 dots
thx
What do you mean by "keep" ?
Do you mean to store a specific set of data?
Trim the incoming data list, regardless of choice of graph package:
do while length of list (L) > 150
remove item 1 from list L
end do while
reload graph
Hi! i'm using your extension and it looks very useful, i have a little problem with my container and zoom and i can't get rid of this.
If there is no zoom the chart looks like this
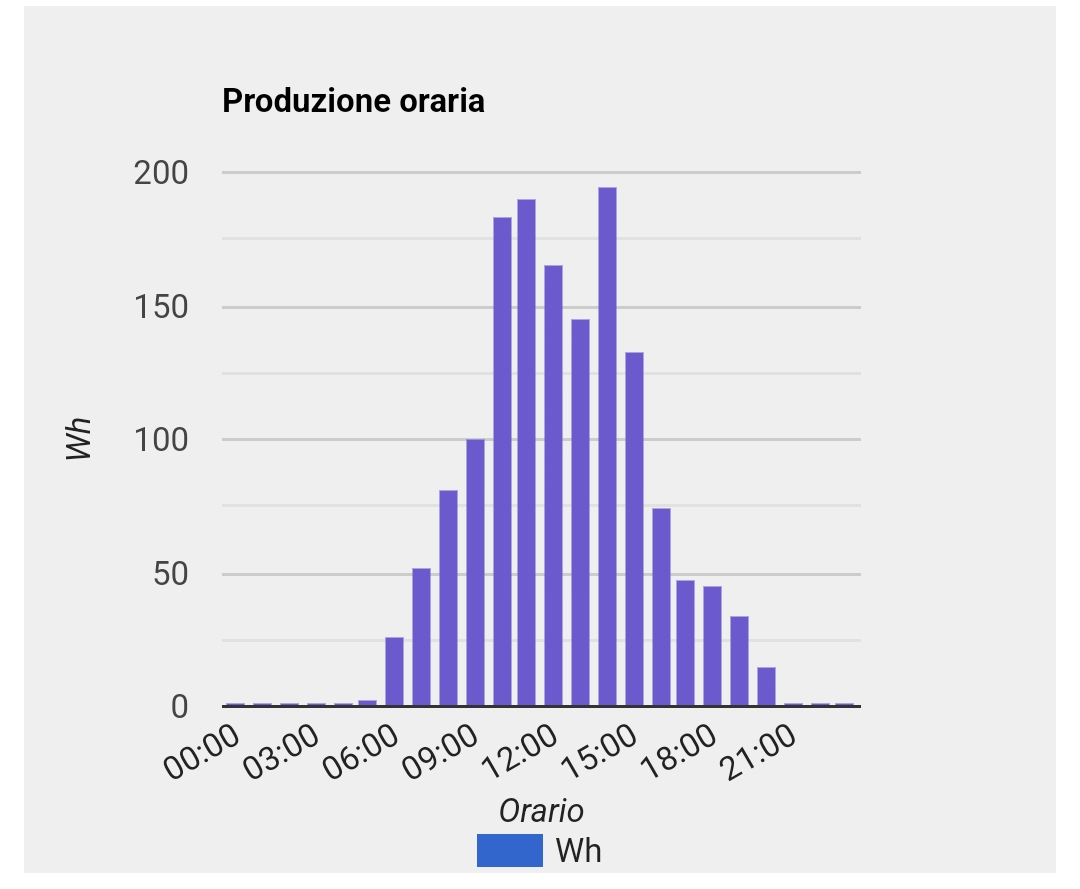
but when an user want to zoom in, the webviewer don't allow that and the result is a truncate image

i've tried with overflow: scroll in the css menù but i'm pretty sure i miss the class of css item, can you give me some tips?
Thank You
Luca