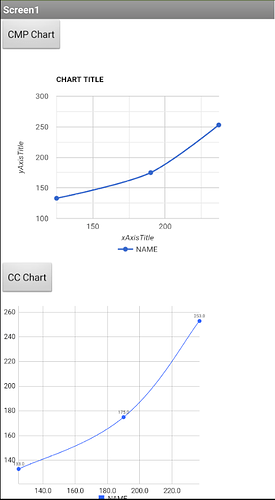
Great job @TIMAI2 !
Before I knew about this extension, I made a (Sp)Line chart with HighCharts.
But now I would like to convert it to your extension.
I went through the google docs but I'm totally lost.
Could somebody please help me with the blocks for the arrayTable (Line Data) and which options to plug in to extraOptions?
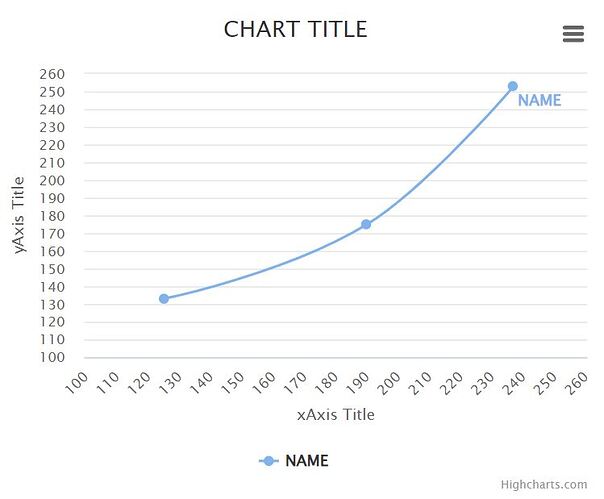
Here is the html code and a screen shot of what I have made in HighCharts, so that you can see what I want to get to:
<!DOCTYPE html>
<html>
<head>
	<script src="https://code.highcharts.com/highcharts.js"></script>
	<script src="https://code.highcharts.com/modules/series-label.js"></script>
	<script src="https://code.highcharts.com/modules/exporting.js"></script>
	<script src="https://code.highcharts.com/modules/export-data.js"></script>
	<script src="https://code.highcharts.com/modules/accessibility.js"></script>
</head>
<body>

	<div id="container1" style="width:50%"></div>

	<script>
		Highcharts.chart('container1', {
			chart: {
				type: 'spline',
				height: 80  + '%'
			},
			title: {
				text: 'CHART TITLE'
			},
			xAxis: {
				title: {
					text: 'xAxis Title'
				},
				type: 'category',
				min: 100,
				max: 260,
				tickInterval: 10
			},
			yAxis: {
				title: {
					text: 'yAxis Title'
				},
				labels: {
					formatter: function () {
						return this.value;
					}
				},
				min: 100,
				max: 260,
				tickInterval: 10
			},

			series: [{
				name: 'NAME',
				data: [[125, 133],[190, 175],[237, 253]]
			}],
		});
	</script>

</body>
</html>
Many thanks in advance!
Walter


