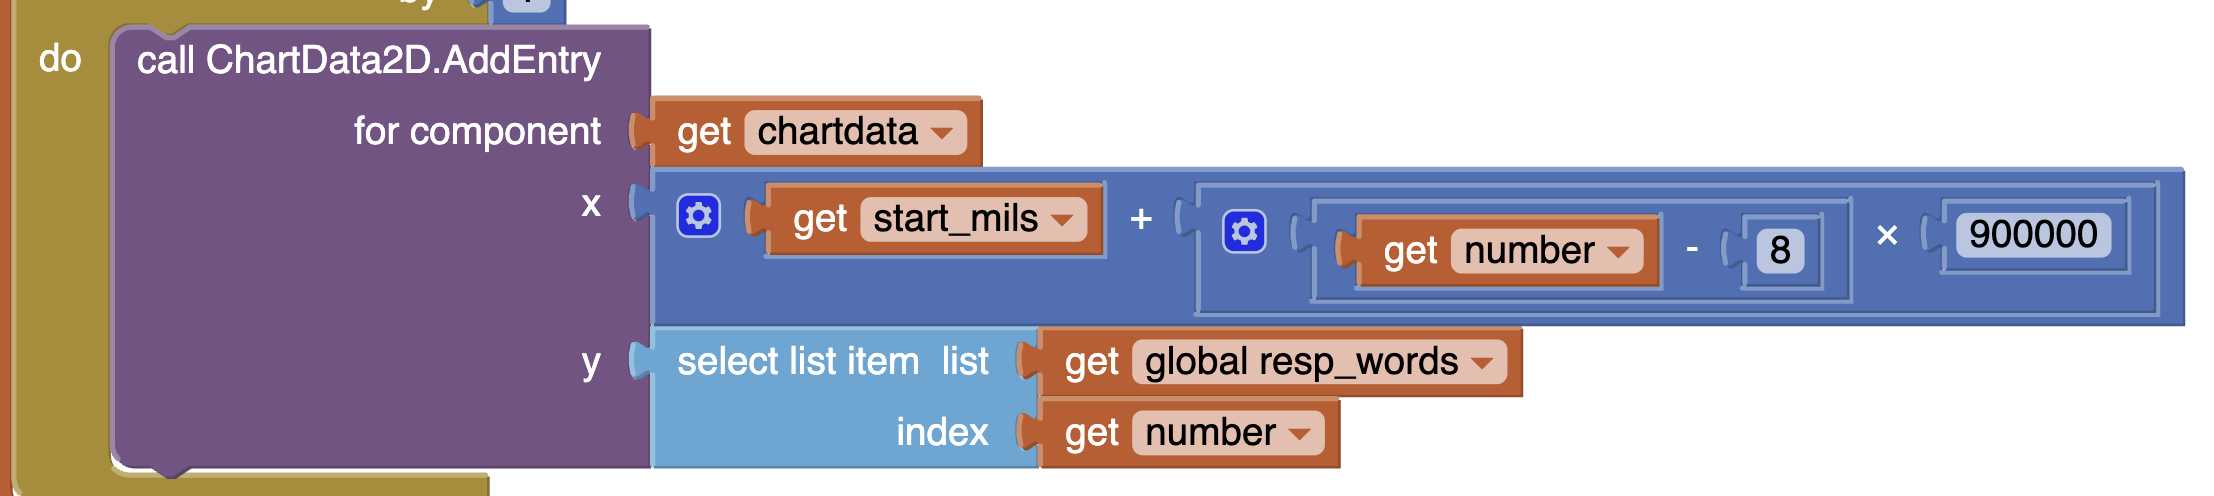
... so the x-values are numbers of millis (that's the simplest way for me to compute the values I want) and the y-values are numbers from a html get request since over wifi.
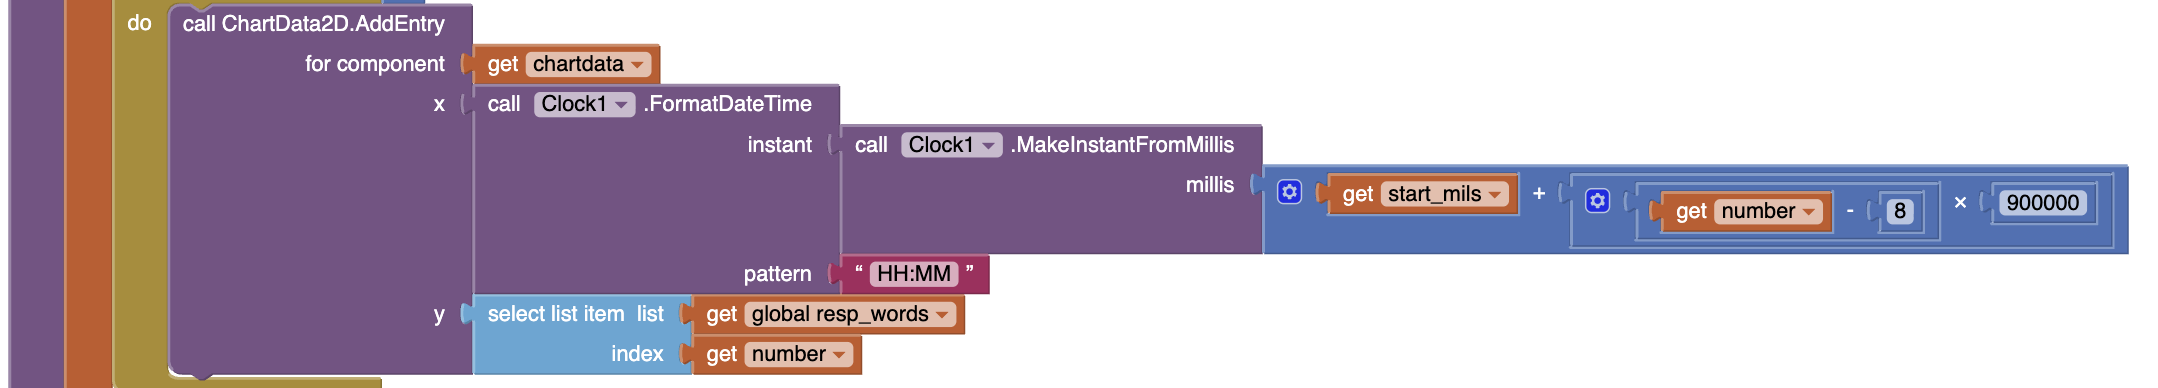
Everything looks good, except I'd like the x-axis time values to be formatted at HH:MM instead of HH:MM:SS.
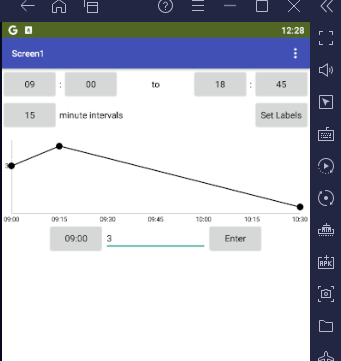
Proviidng a list of two-element lists does not work, because the x-labels are not spaced correctly (i.e. 10:15 and 10:30 are closer together than 10:45 and 11:00).
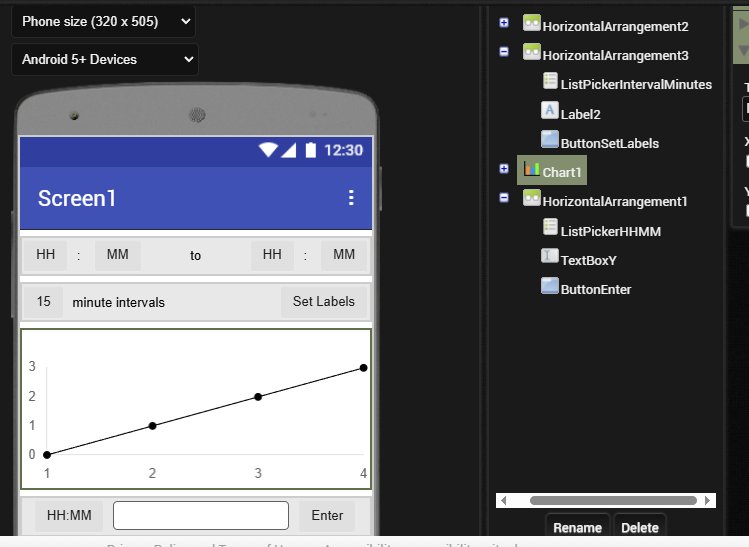
The Time range List Pickers at the top are wired to keep the From Hours less than the To Hours.
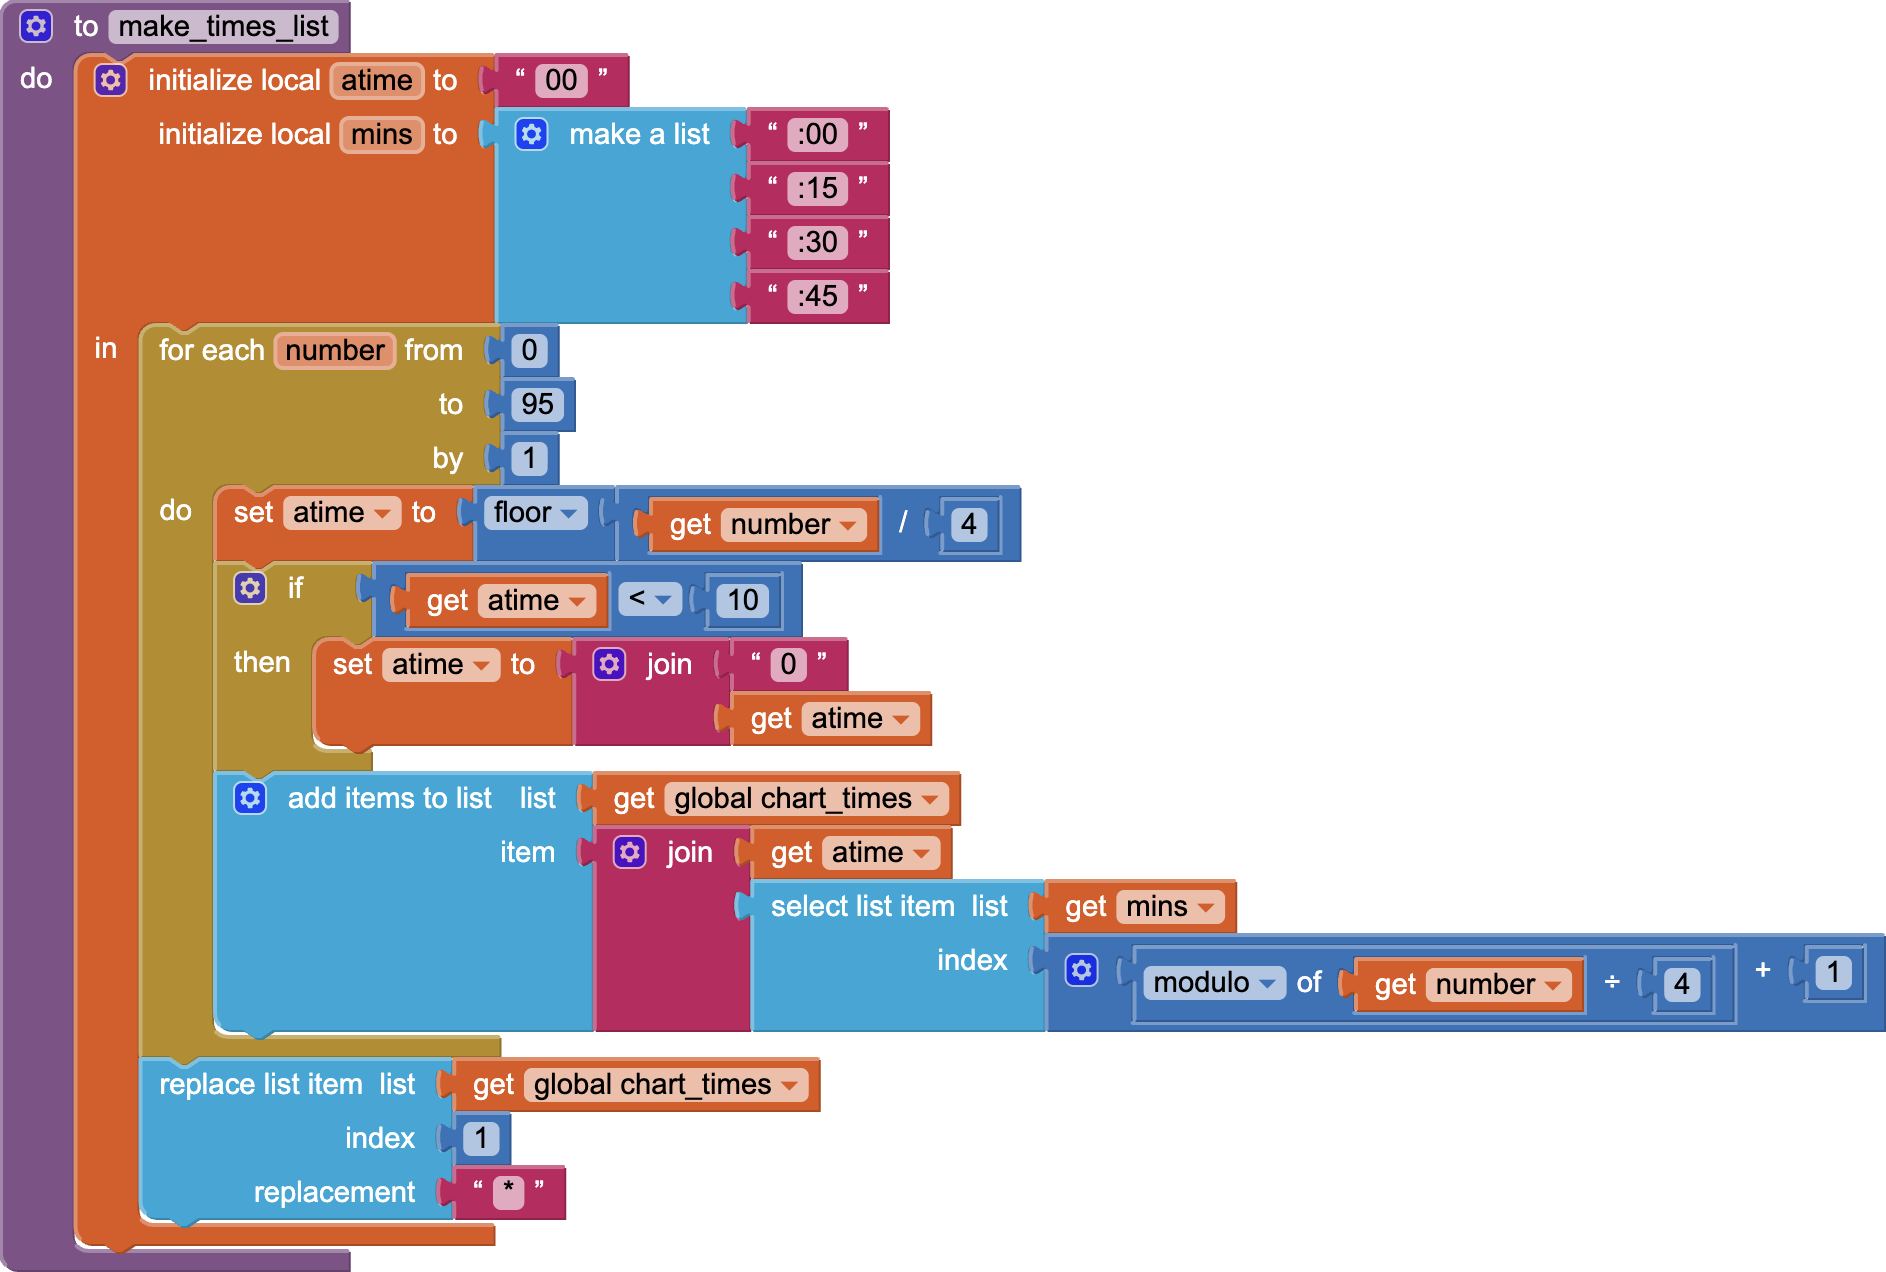
The interval minutes choice is used to populate minute Elements in the List Pickers and in generating an Elements list for the data entry HH:MM List Picker.
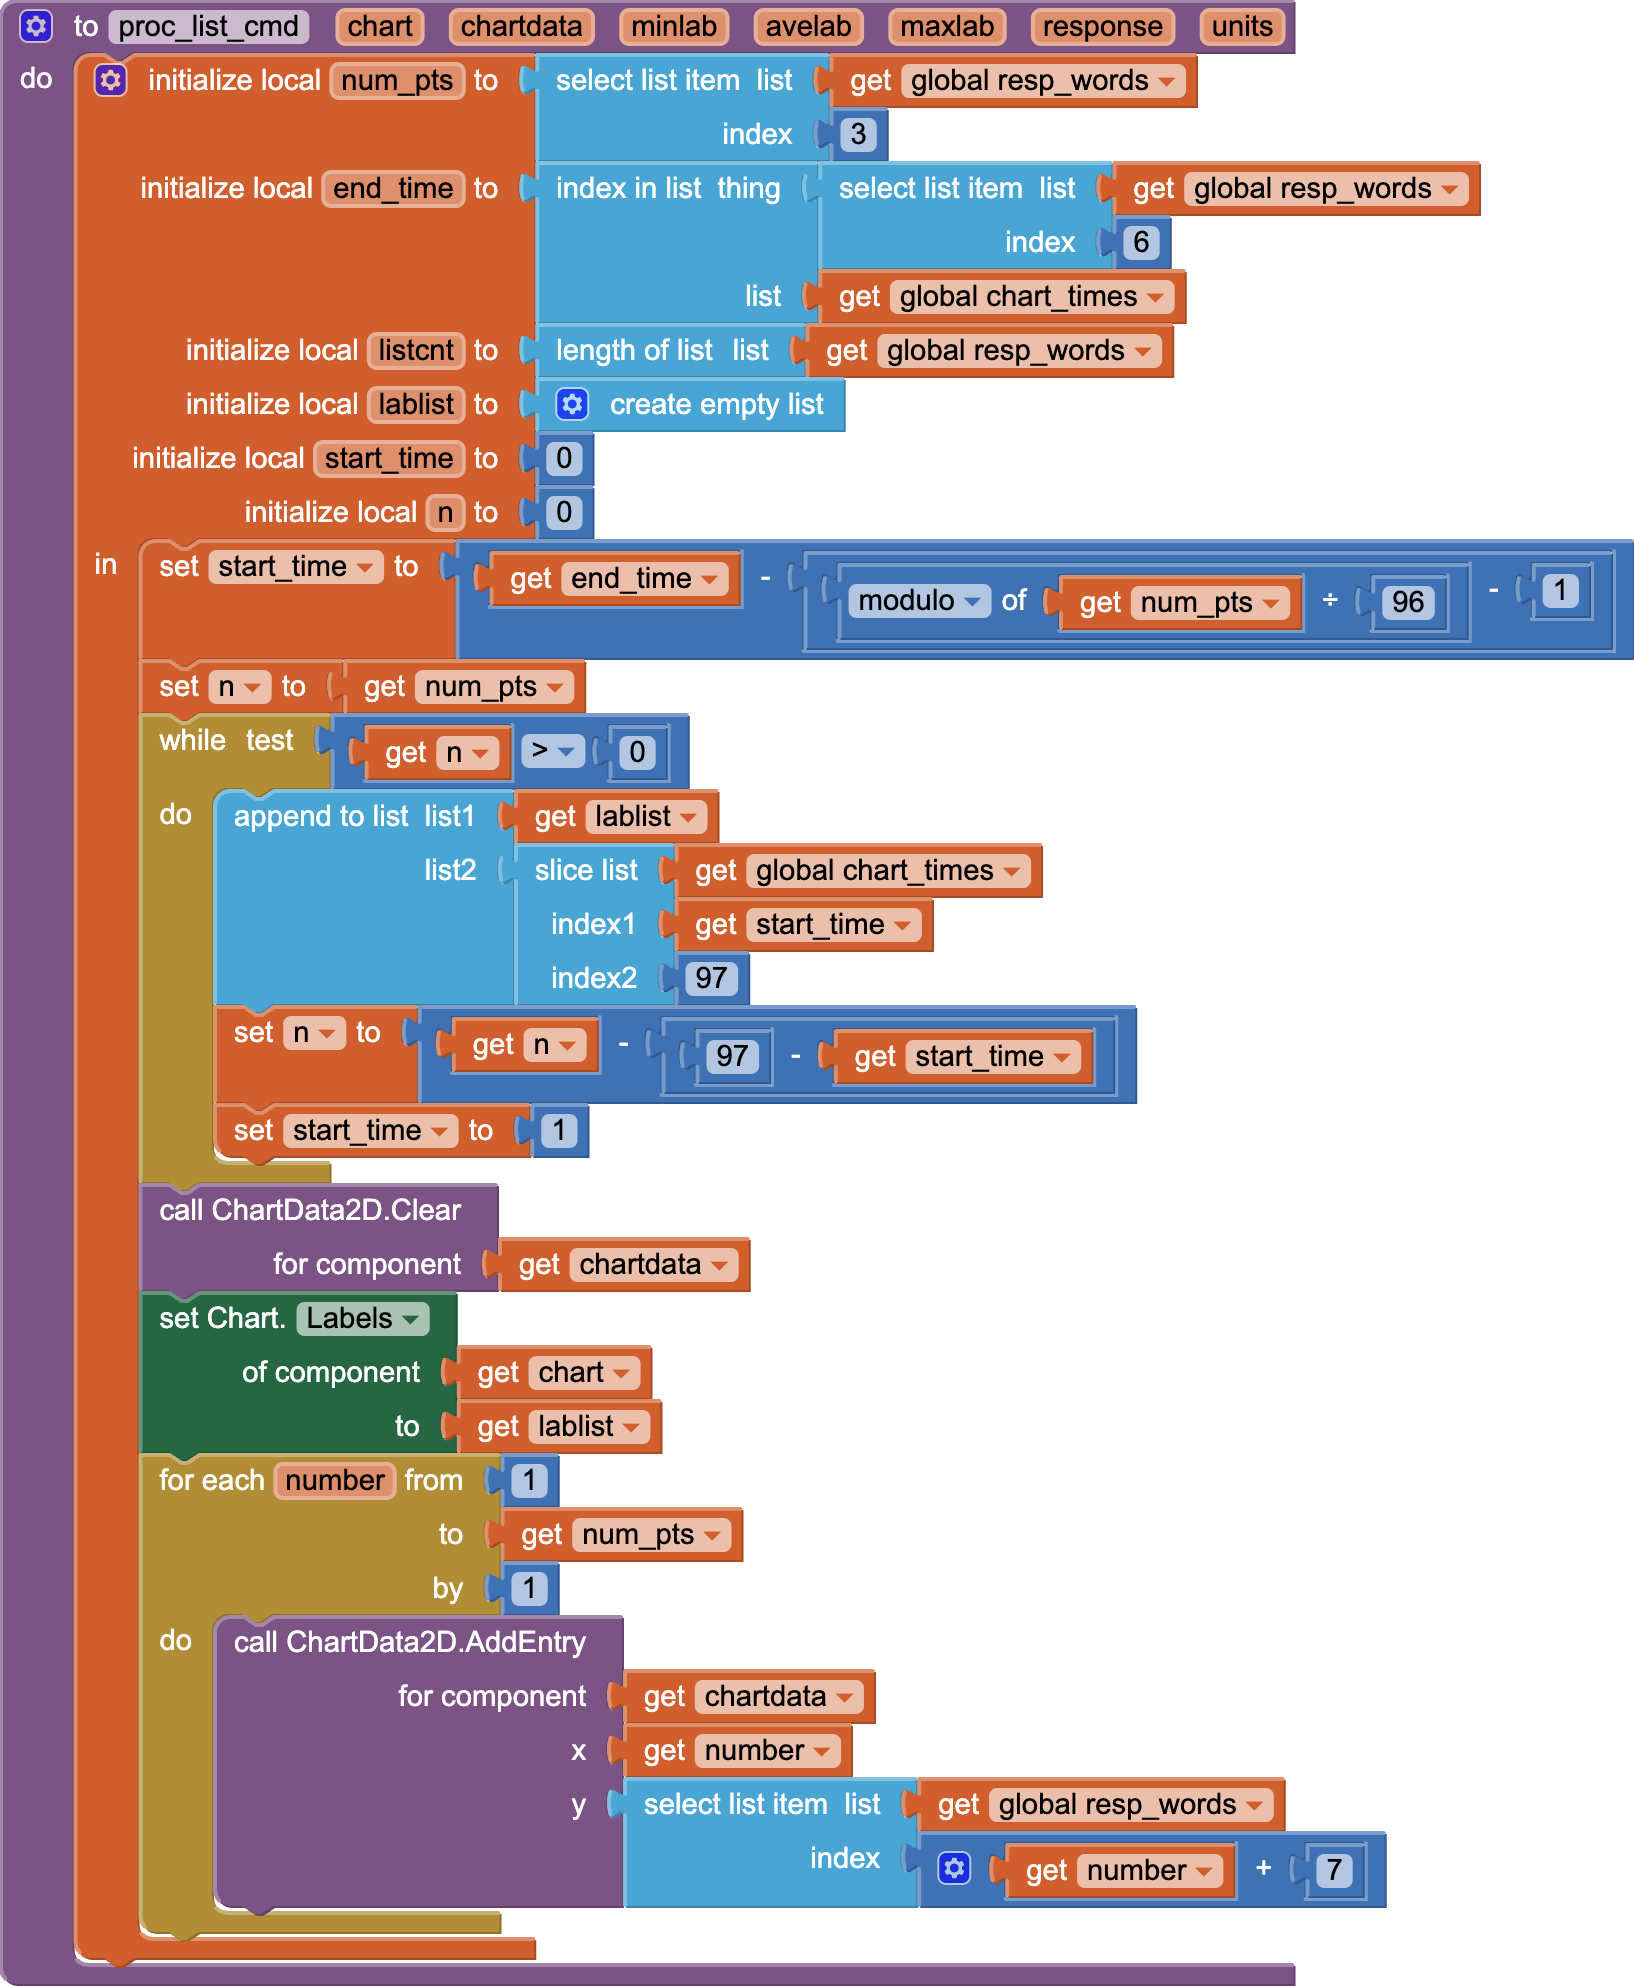
That Elements List has all the HH:MM Labels for the graph, and is the foundation for determining the x value of any graph points, counting from 0.
Having the graph Labels pre-populated allows for gaps in the incoming data.
The points I want to graph arrive as a response to a html get request sent over wifi. I break the response into response_words, which have the data points, as well as explicitly stating the number of data points num_pts and the time the last data point was collected end_time.