[Extension] Dynamic graph. Shift left graph. Sinusoidal wave. Bluetooth

5.- Screen1 to connect. Screen2 to view data.

p299H_GraficoDinamico_5.aia (12.6 KB)

:house: The application must be installed

  • Screen1 to select and connect Bluetooth.
  • Screen2 to view data graphic with an extension.
  • We can go from one Screen to another without losing the connection.

Screen1.

Screen2.

// Juan A. Villalpando
// http://kio4.com/appinventor/299H_extension_GraficoDinamico.htm

#include <SoftwareSerial.h>
SoftwareSerial BT(2,3);

String texto = "";

void setup(){
 BT.begin(9600);
 Serial.begin(9600);
}
 
void loop(){
  // Send random every 800 ms.
  delay(800);
  texto = (String) random(0,1000);
  // Serial.println(texto);
  texto = texto + '\n';
  BT.write(texto.c_str());

  // If receive BT, write.    
  if(BT.available()) {
    Serial.write(BT.read());
    }

  // If Serial Monitor, send data by BT
  if(Serial.available()){
    texto = Serial.readStringUntil('\n');
    texto = texto + '\n';
    BT.write(texto.c_str());}
}
  • Sketch sends random every 800 ms. by BT.
  • You can write a number on Serial Monitor and send it by BT.
  • You can write a text in the app and send it to Arduino by BT (check Serial Monitor).
3 Likes

(added to FAQ)

Hello dear ,
I want to stop the shifting at a certain point .. how to freeze it ? Like my Arduino sensor is sending bell shape once it hits back the zero Y I want to stop it ? I see we have two options , either one screen … no shift or keep going shift left forever … how can I stop the graph as is at a certain point ? … thank you so much for your help

You can do the control on the Arduino,

(schematic code:)
if valueinArduino = 0 then sendtoapp 999999

Then in App
if ReceiveText = 999999 then Clock.Enabled=false

thank you so much .. working like a charm ! ... now i have full control of it except i am missing the following:
1- my horizontal x line can be 2 min or 2 hours ... if i need both cases to be in ONE screen .. how can i change X scale according? (before i start plotting i do not know in advance if it will be 2 min or 50 min or 2 h ..) ... can i zoom in out ? like using two fingers to change x scale ?

2- lets say case one above is not possible and my x for one screen wide of my cell is 10 staps while my graph is 30 steps ( like 3 screens wide) once graph done .. can i scroll right - left to see the whole graph in the 3 screen width?

btw i tried changing the kio4 dynamicgraph.resolution > to Slider1.thumbposition which works fine with NEW upcoming data to be plotted, not the previously plotted data.

6.- Save all values in a List. Show graph with saved values.

p299Hi_GraficoDinamico_7.aia (18.4 KB)
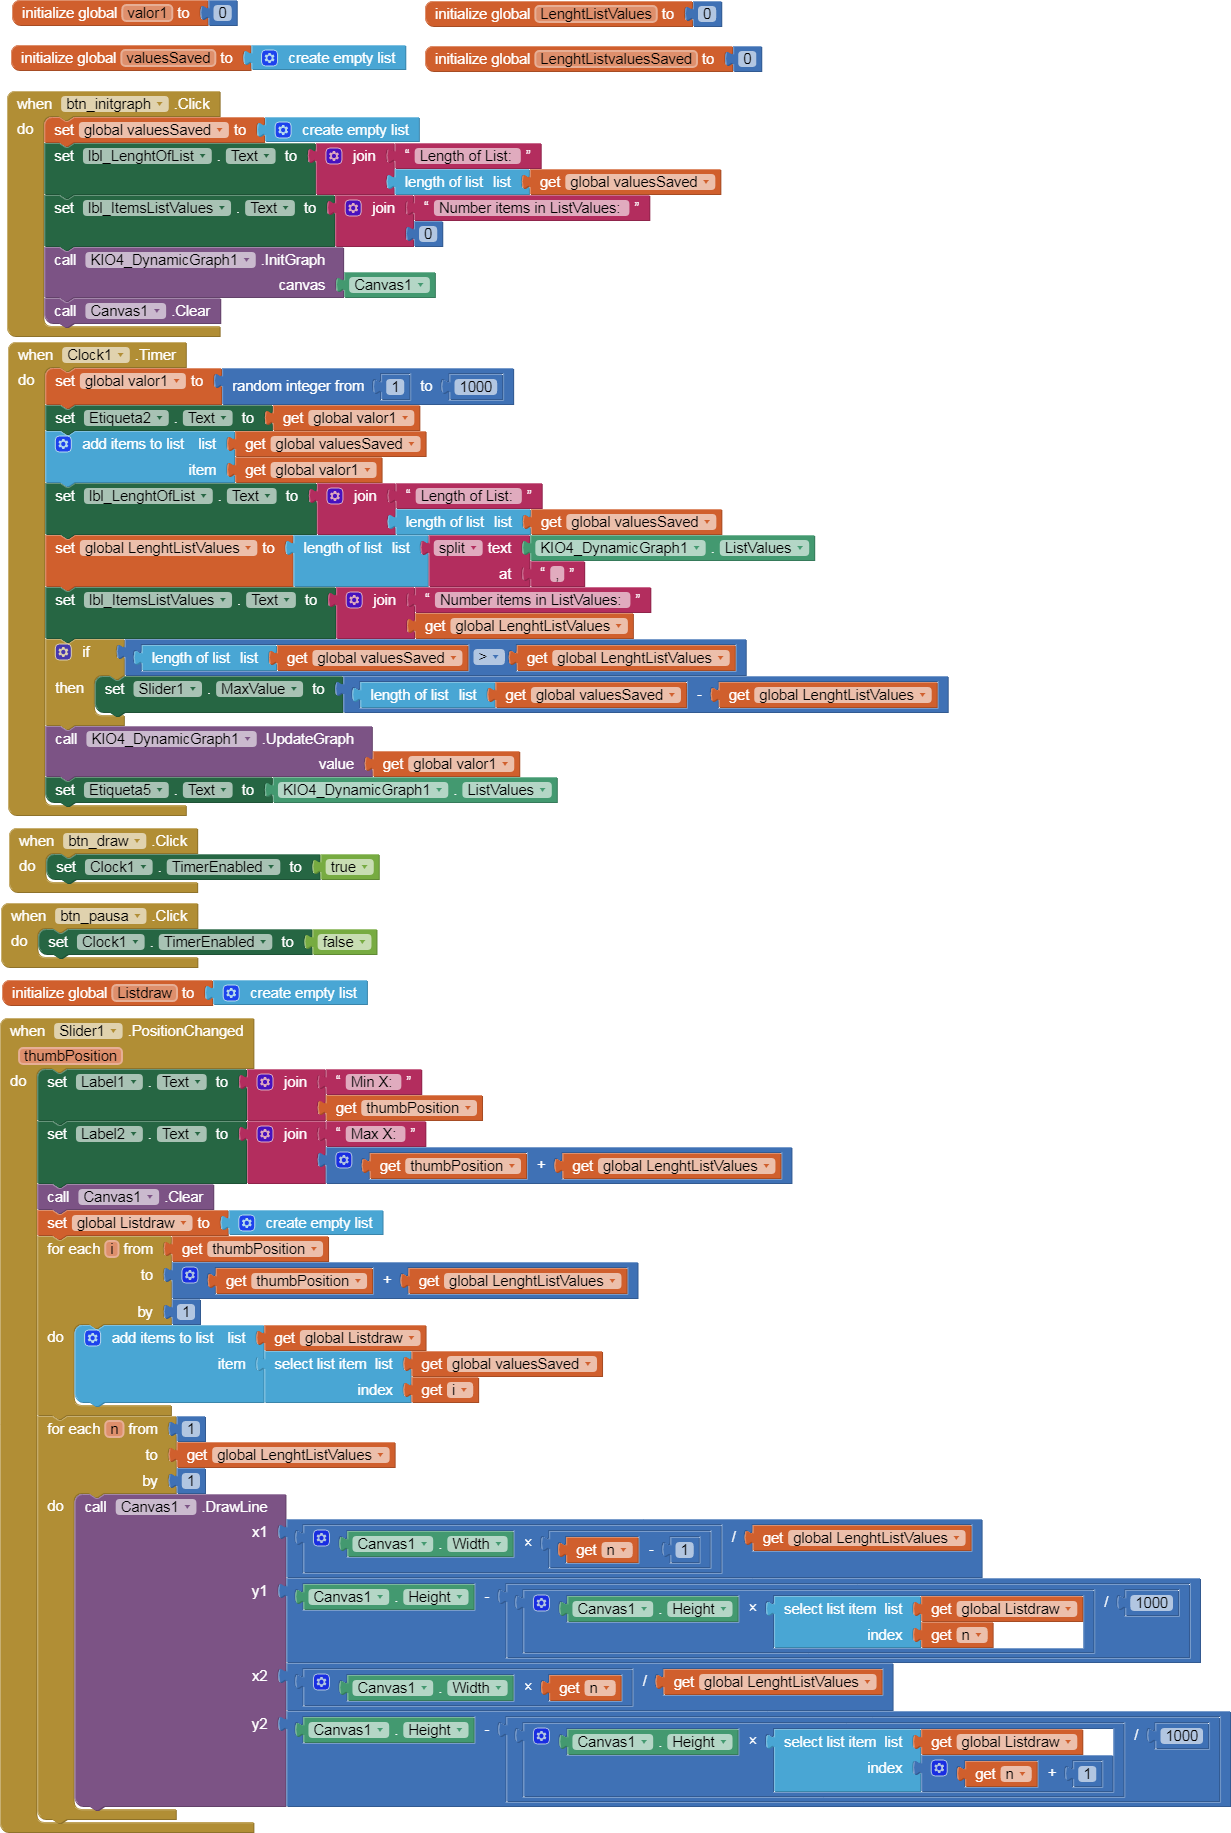
Save all the values ​​in a list.
Pause.
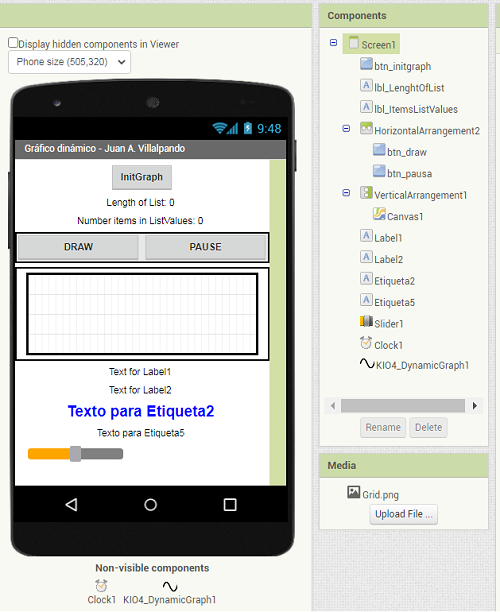
Using a Slider to display graphics on the Canvas with the saved values.

thank you
google chart means my cell must be connected to internet right ? .. i mean if i need it to plot the graph offline (i am using bleutooth to arduino) .. can i save the google js file at the arduino then that file will generate the grapf without need of uploading it to google chart live?.. possible?
thank you

Files in app, check:
http://kio4.com/appinventor/169D_javascript_graficos.htm

1 Like

OMG ! i never thought i can use google chart with off line ! .. now i can make either Bluetooth or access point and while my cell is NOT on the internet data and even draw the graph ! this is great tutorial in your link .. not sure why i never came across it ! .. maybe cuz i was searching in english while its original is Spanish (i guess ! , i asked google to translate it so i know what is that ..etc ) sorry i know 3 languages but Spanish is not one of them . have a wonderful weekend.

You can't! Juan's guide uses chart.js which works in a similar way, but allows you to download the entire javascript required (which you cannot do with google charts)

I think it works without internet connection.

I build, I install.
I disconnect the mobile from Data and Wifi.

I start the app and it works.

p169Di_javascript__graficos_2.aia (113.6 KB)

@jgh_jkhg
BTW:

Change this to...

file://localhost/barras.htm

1 Like

guess what .. works like a charm .. i did loadcell scale (hx711) but with variable load up and down ,... i have a nice graph now. ..

  • i do not know if i can now use it online! i know i can conne app inv 2 via bluetooth or esp32 as access point .. but can i connect via internet (i have no static ip home nor ddns ) .. like blynk or remotexy both can connect online via internet/cloud .. can i through app inv ?
    be blessed :slight_smile:
  • if answer is NO i can't .. then should i upload app inv2 to tinyDB cloud or firebase ? then ask esp32 to access it ? possible ? .. just concerned about data security .. etc (is it possible direct connection between app in and arduino remotely via internet ?)

Find information about Firebase, MQTT,... in this Community.

1 Like

Juan, such prompt VOLUNTARY help and straight forward to the point is a remarkable grace from you .. thank you so much Juan

thanks for clarification TIM

hello Awesome man,
i have three values to draw .. so i used {{call kio4dynamicgraph1. updategraph2}} .. two values are plotted fine .. then on same page i added {{call kio4dynamicgraph1. updategraph}} and i added the 3rd value there (using same block ) .. but i get nothing ! .. would you please shed me some light here.. thank you so much

@jgh_jkhg
UpdateGraph blocks cannot be added, because each block deletes the information of the previous one.
If you need a block with three values, tell me and I'll add it to the extension.

three_sin_waves_3.aia (11.4 KB)

  • seems i did not explain my inquiry well .. i was wondering how to plot many different graphs with different variables each .. done and attached .
  • if you would like to do extra , please add scroll right/left avaibility once clock is disabled and graph is stopped, assuming we need to roll back to previous portion of the graph .. how to scroll it back and forth ... i know now once it has been plotted then it is forgotten .. can you add tiny db or so to keep last 2-3 min .. or can you write example how manually can we implement that ?.. thank you so much for the great extension you did so far... helped us ALOT.
  • WOULD BE SO NICE HAVING THREE VARIABLES IN SAME GRAPH AS WELL

I have updated the extension by adding a block for three values.
See post 6.
To observe historical values, you must save the data in a list and display the values ​​that interest you. If you save many values ​​(2-3 minutes) the list will be very large.

wow..
i can not thank you enough..

fyi correct url to downlad : http://kio4.com/appinventor/299H_extension_GraficoDinamico.htm
because when click on your link (See post 6) .. it takes me to post#4 of two variables.

thanks for adding min-max here too.
thanks alot