Temperature animation display

Hi everyone

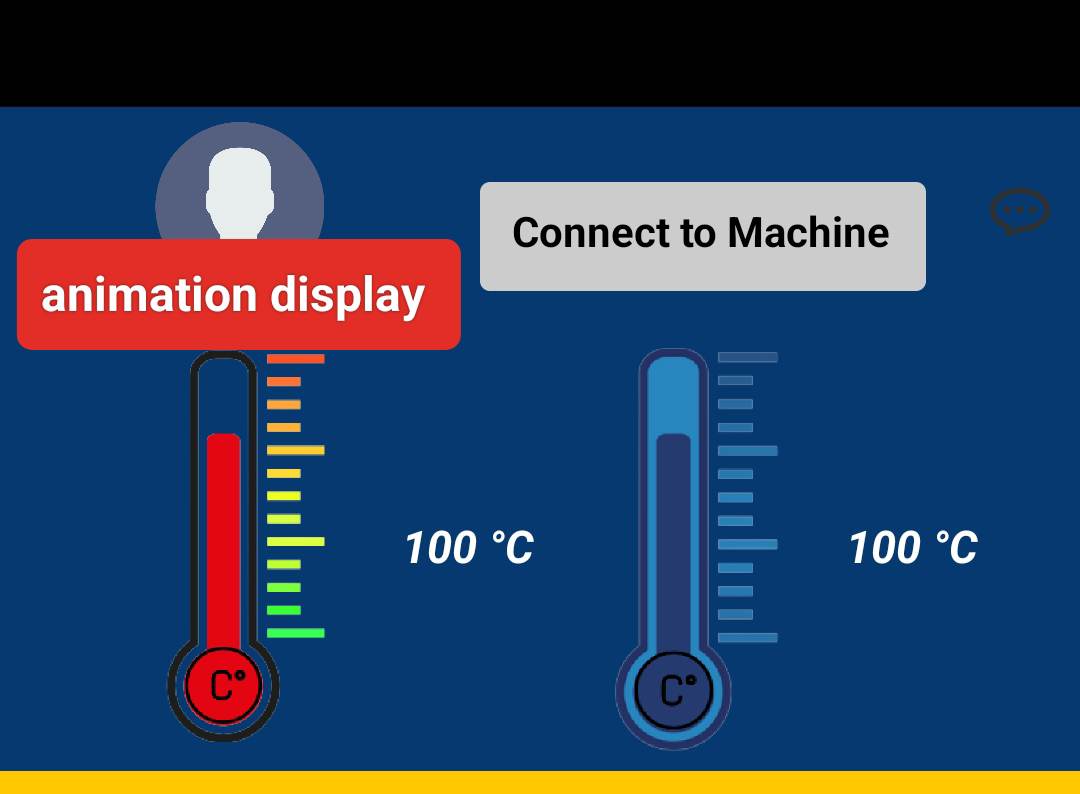
I am looking for any assistance or support in this matter, and I would like to ask anyone with knowledge regarding temperature to create an animation display based on the data provided by Arduino. In a code block example, mobile apps received temperature data ranging from 150 to 250 °C from a source such as an Arduino display. I'm not sure if I've explained myself clearly.

Study up on the Canvas.

Everything you have there can be drawn, using circles and fat lines, if you do it in the right order.

(Except for the head.)

You might use a gauge.

This link shows how to make a gauge using two methods; one using a Canvas, the other using a GoogleChart and javascriipt:

Make an Analog Gauge and use it to display something useful .

The examples can be adapted to use data ranging from 150 to 250 °C .

For more advice, see this article