Showing data in graph

I'm trying to create an app where you take a short quiz that uses sliders to answer, and the data from the quiz would show up in a graph after, but I can't figure out how to make it properly display. What blocks or components should I be using for this?


Please help! I really need to get this done :sob:

(Canned Reply: ABG- Export & Upload .aia)
Export your .aia file and upload it here.

export_and_upload_aia

.

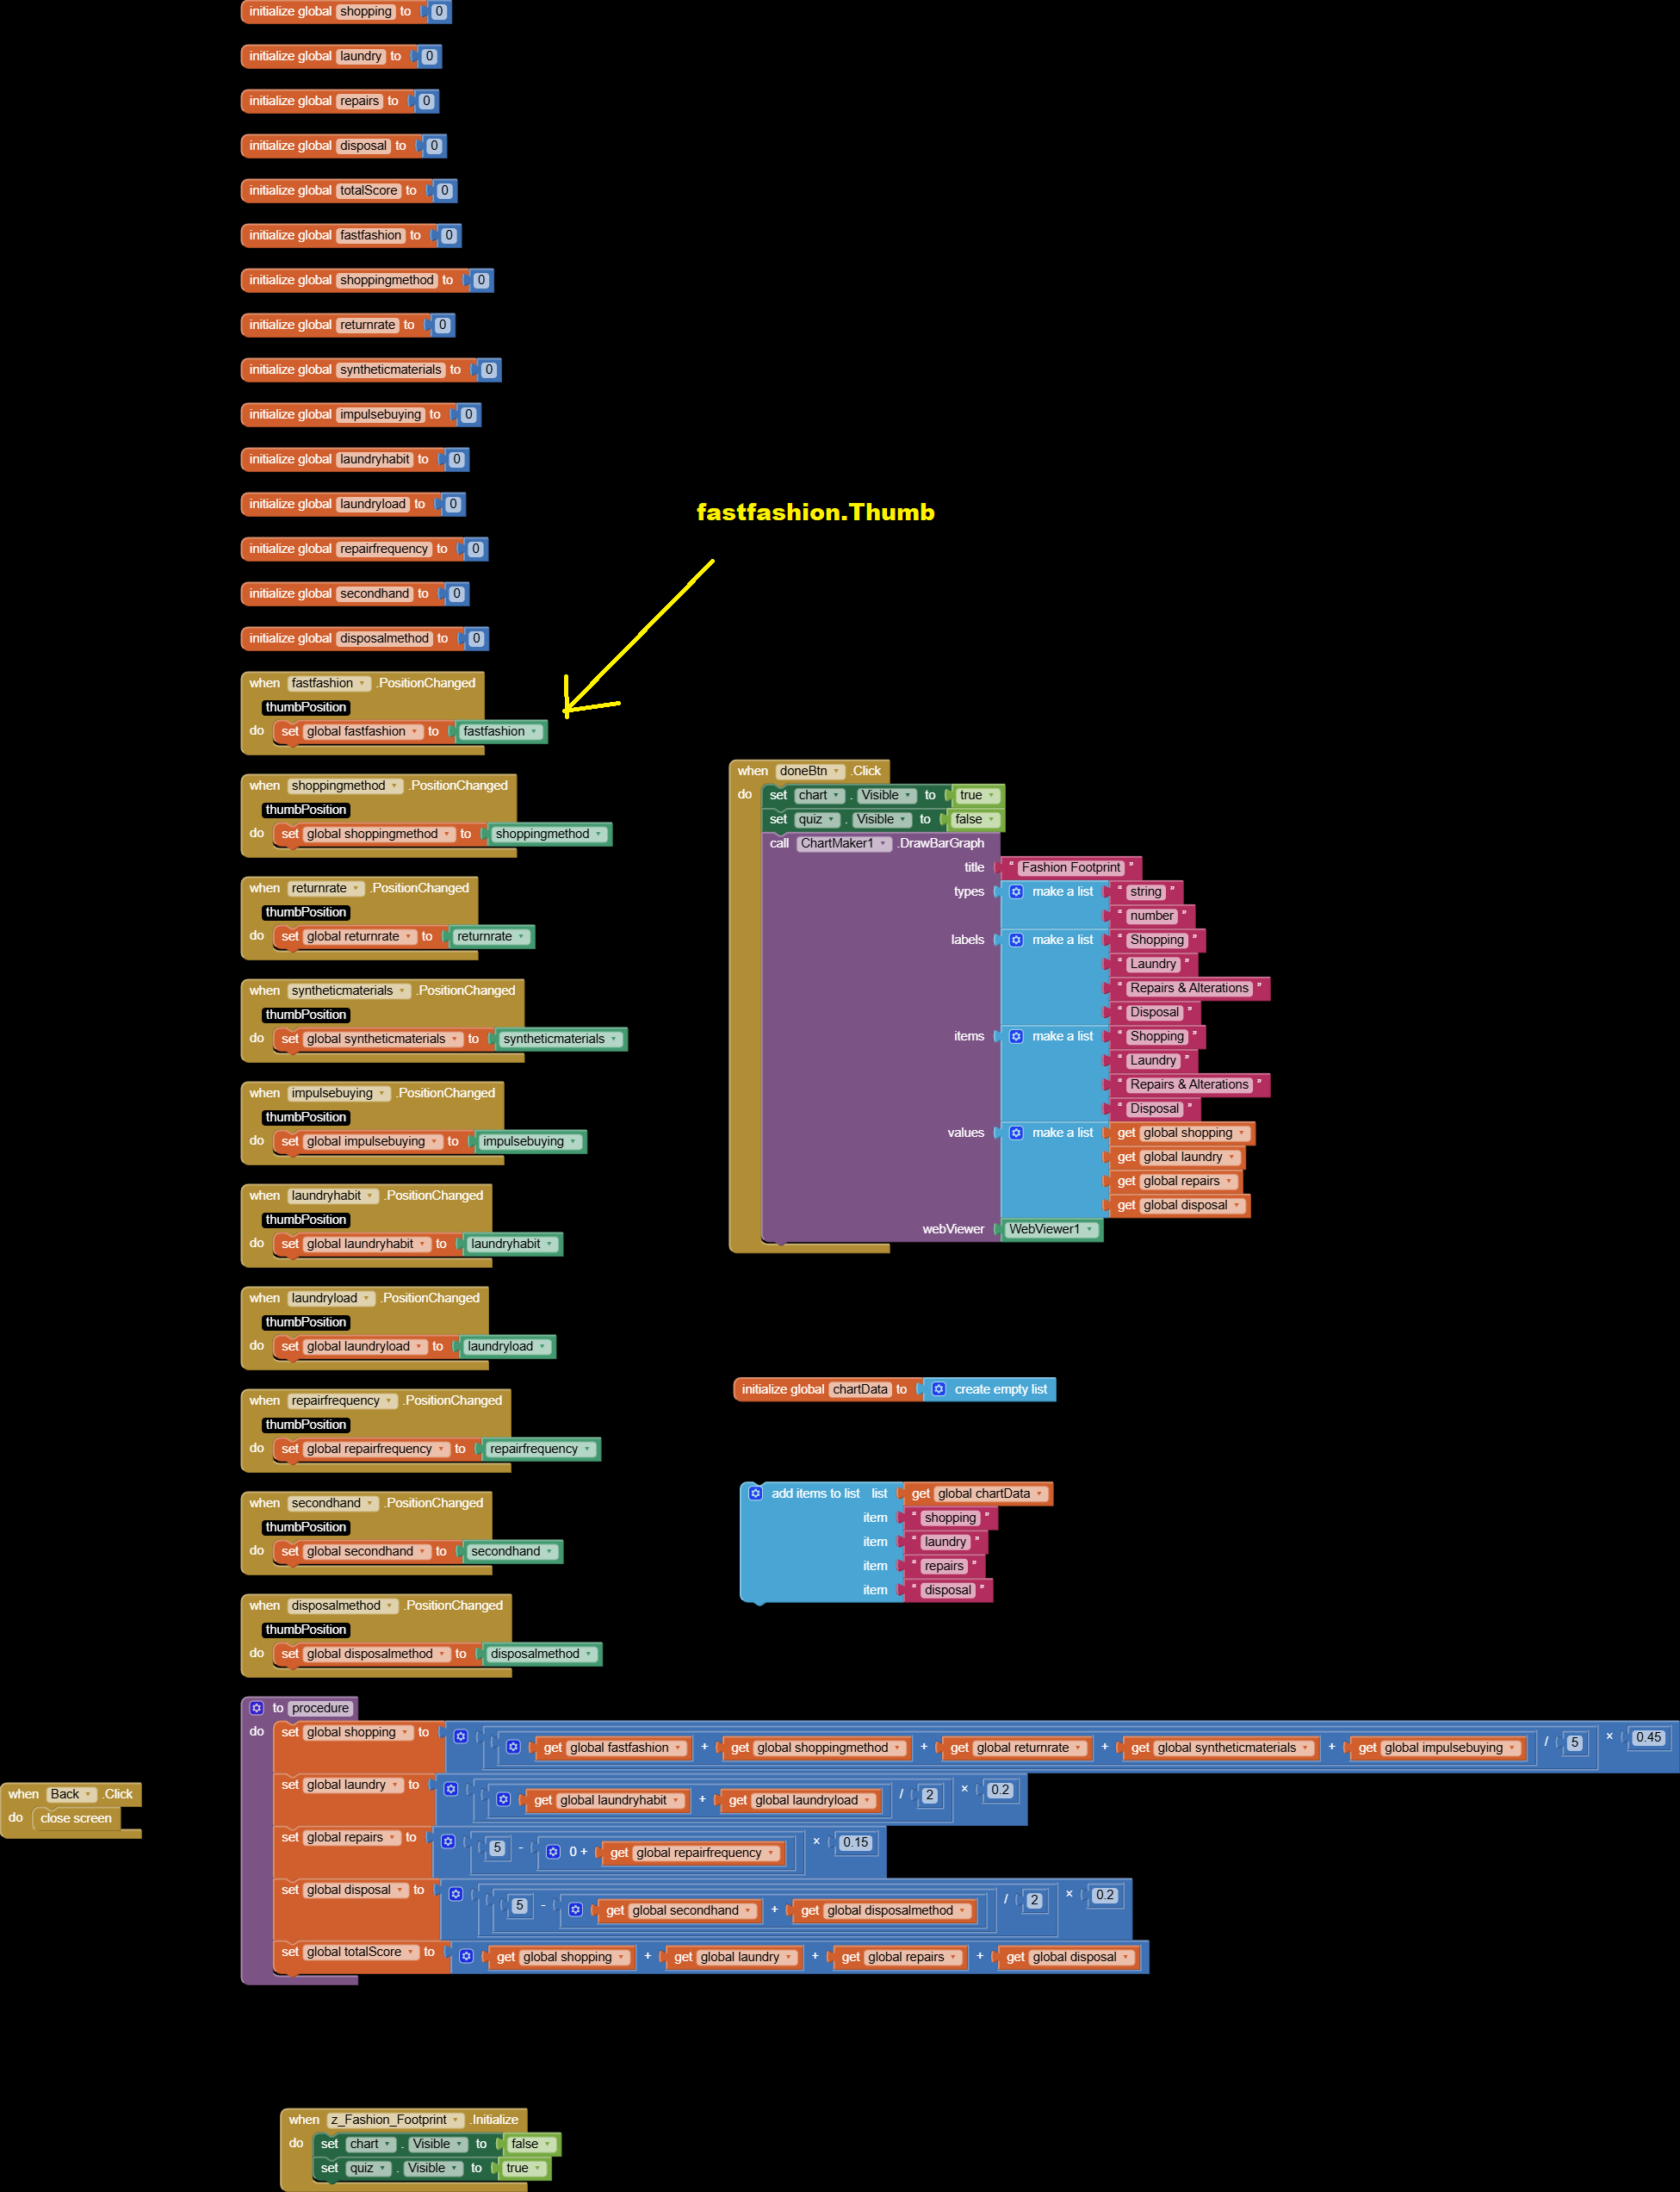
You are grabbing the slider components.
You should be taking the thumb values of those components. That's where they keep their numbers.

I can't vouch for your use of any charting extensions.

You may have more success with ChartMakerPlus