yes sorry .. I am editing it
it appears I need to update my png editor ![]()
yes sorry .. I am editing it
it appears I need to update my png editor ![]()
You can set Webviewer's width as 2 x screen1. Width
you can add 2 buttons, like LEFT and RIGHT
first show points from 1 to 50(?),
when right.clicked,
show points from 2 to 51, then 3 to 52, then 4 to 53
same to left button.
You can use the SLICE LIST as @ABG mentioned.
good point. Seems simple and efficient
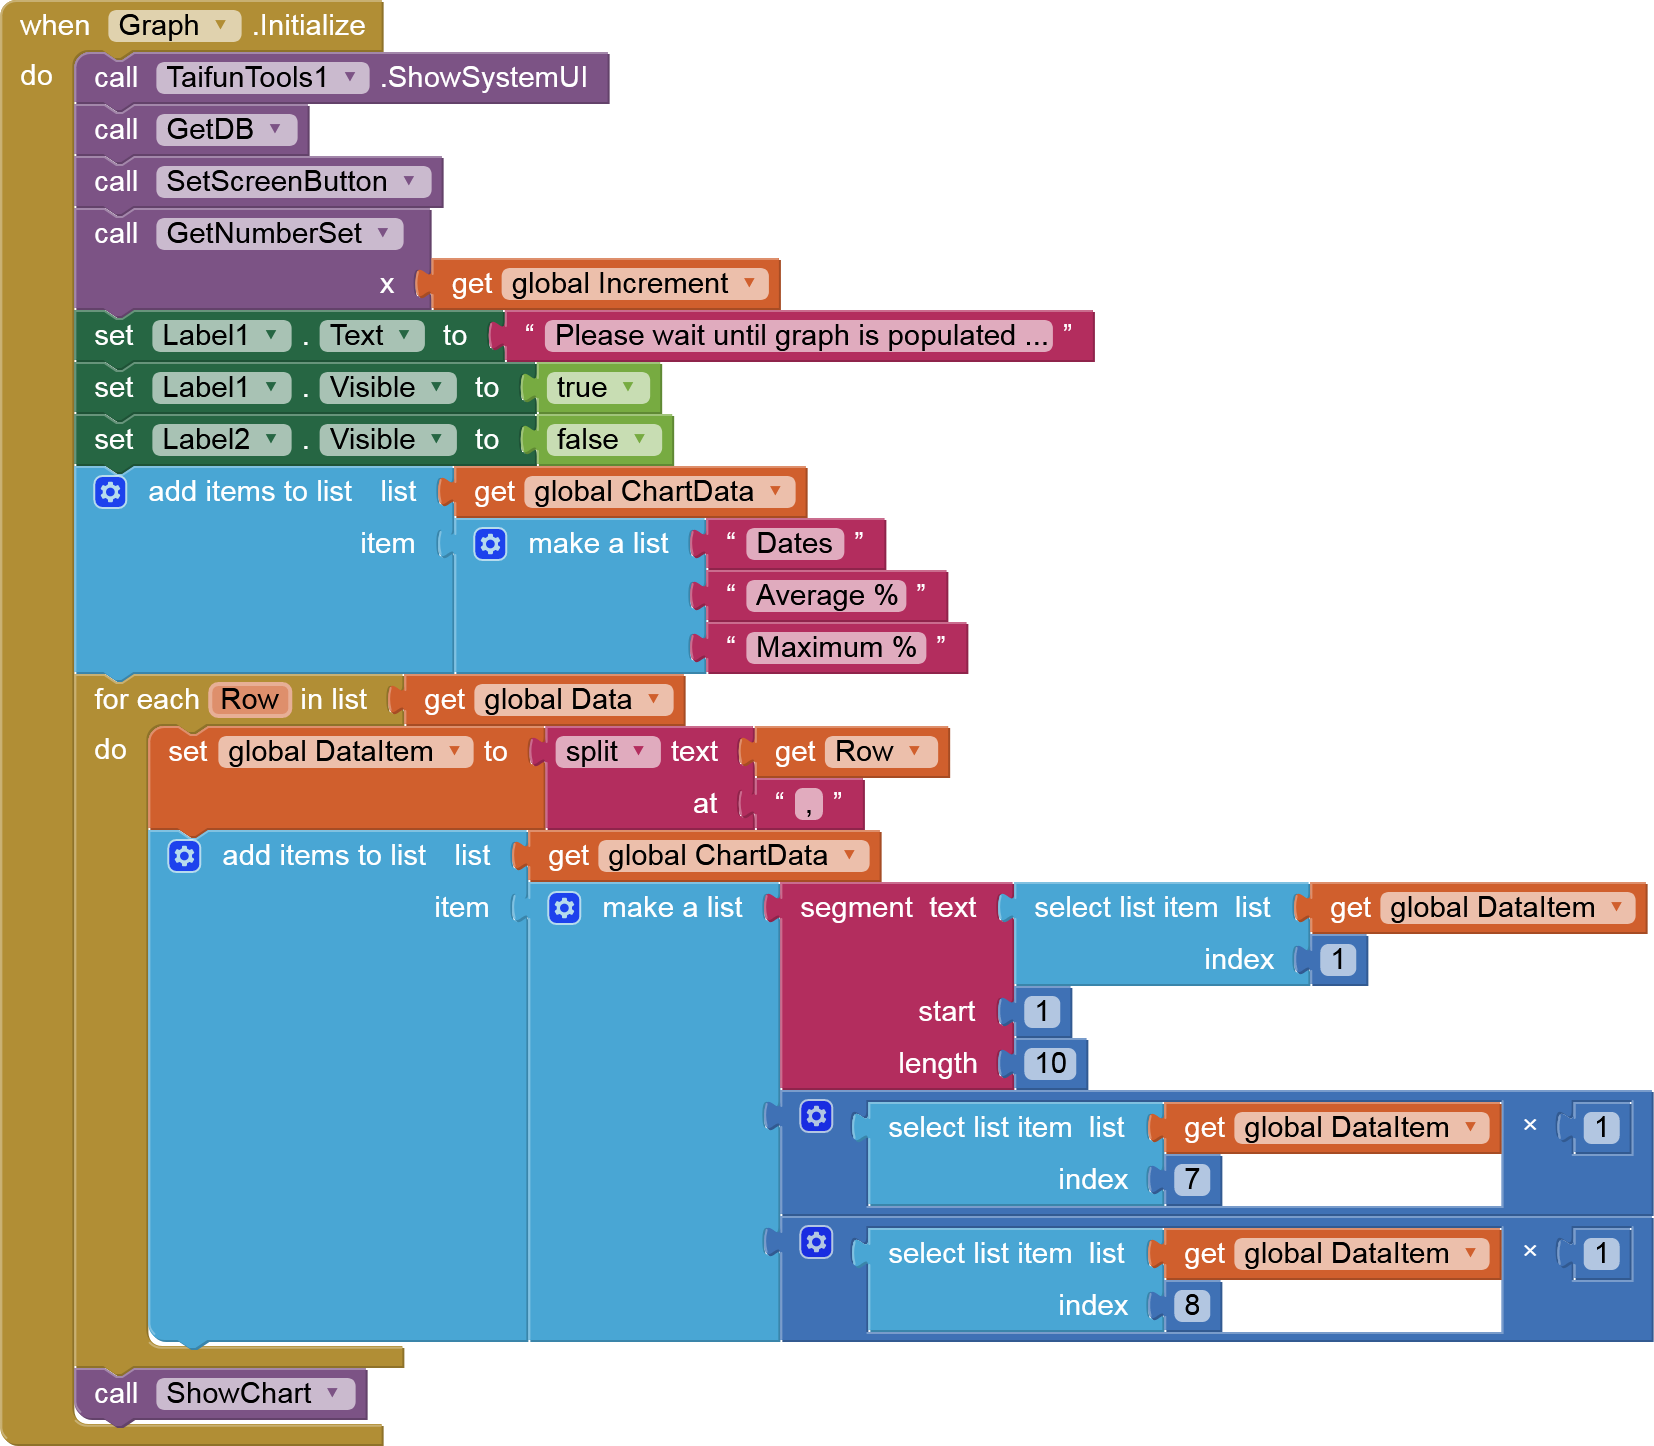
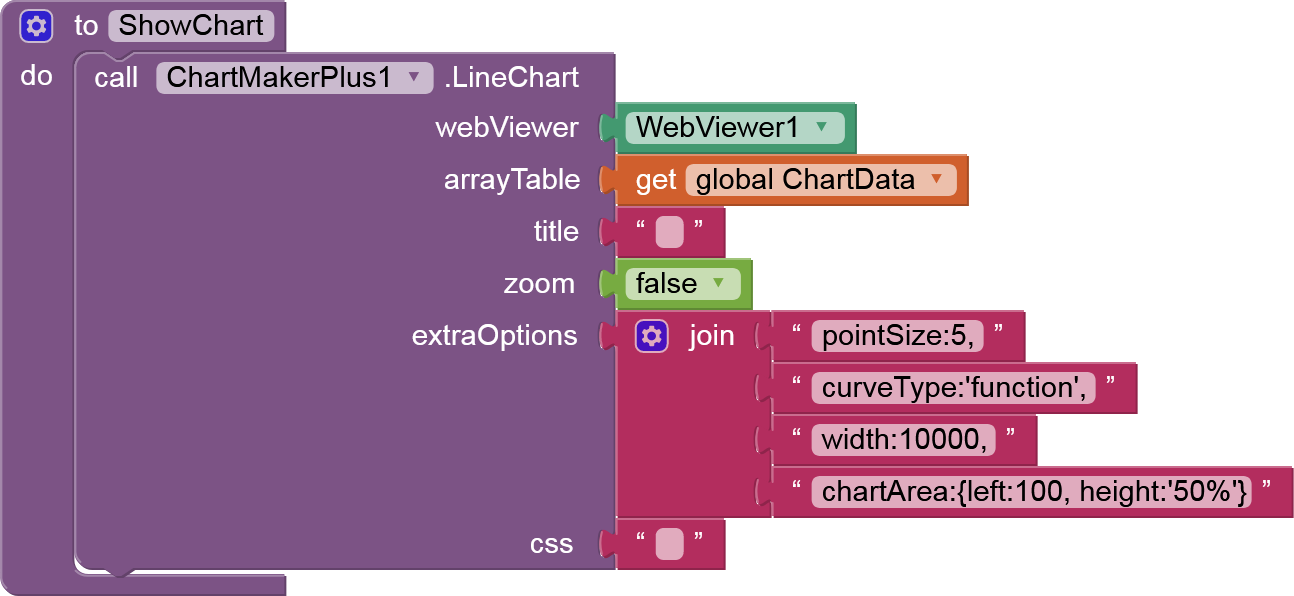
Figured it out with ChartMakerPlus:
You will need to adjust the value of width, left and height accordingly
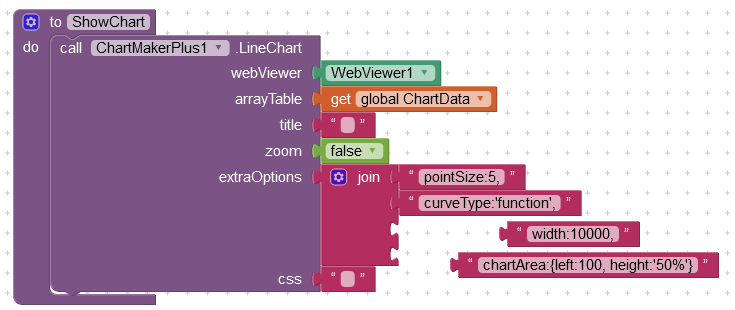
I am attempting to show 20 points of data at a time.
I built an algorythim to move segments left and right using Index1 and Index2 global variables.
I cannot get it to display. This is what I have
Use 'Segment ' block on a list? Try use 'Slice ' block from list drawer.
You have decided against scrolling the entire dataset, as in my example above ?
No Tim. To be honest I don't know how to implement it. I am just trying out whichever method as best I can.
I really don't understand the chartmaker. If your method is better I will do that. Is it possible you could show me using the blocks I have shown here?
Thanks...
Hmm seems too simple. I am a bit burnt out from all the long hours of programming. I suddenly realized I only have to change the ShowChart same time you sent this message.
It's 20:00 rest time here. Will implement it in the morning
OK I could not resist. WORKS GREAT!
One problem: the dates are not on the graph along the bottom
This part:
Which method ?
Don't understand what you are doing from your partial showing of blocks
Show an output of the data you are sending to the chart.
Thats a partial view of where the dates are input into the list. The full view is this:
I need the dates along the bottom of the graph under each point.
Make sure that each date is a string, if it looks anything like a date/number google charts will not like it (as much)
Hmmm the dates were input same way before and did show up fine before I began trying to scroll
An example of the arrayTable you are building:
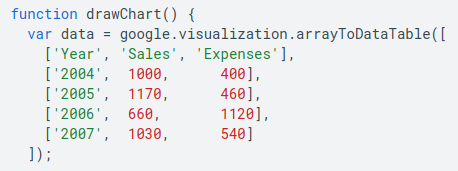
First Version:
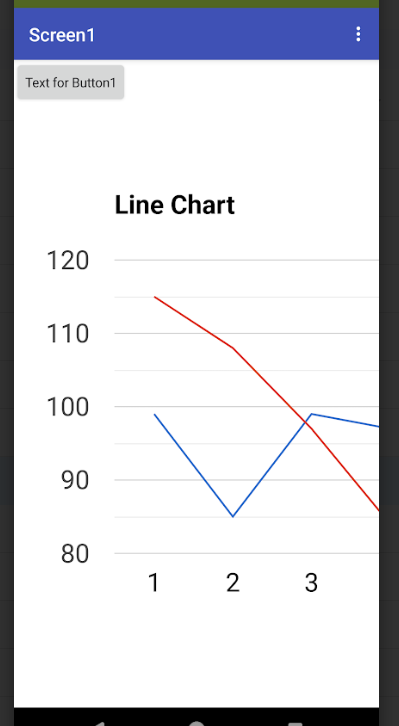
Produces This:
Your Way:
Produces This:
In the first version the dates (05/15/2023 format) are not fully displayed, I think due to crunching of so many data points.
Your version produces no dates at all.
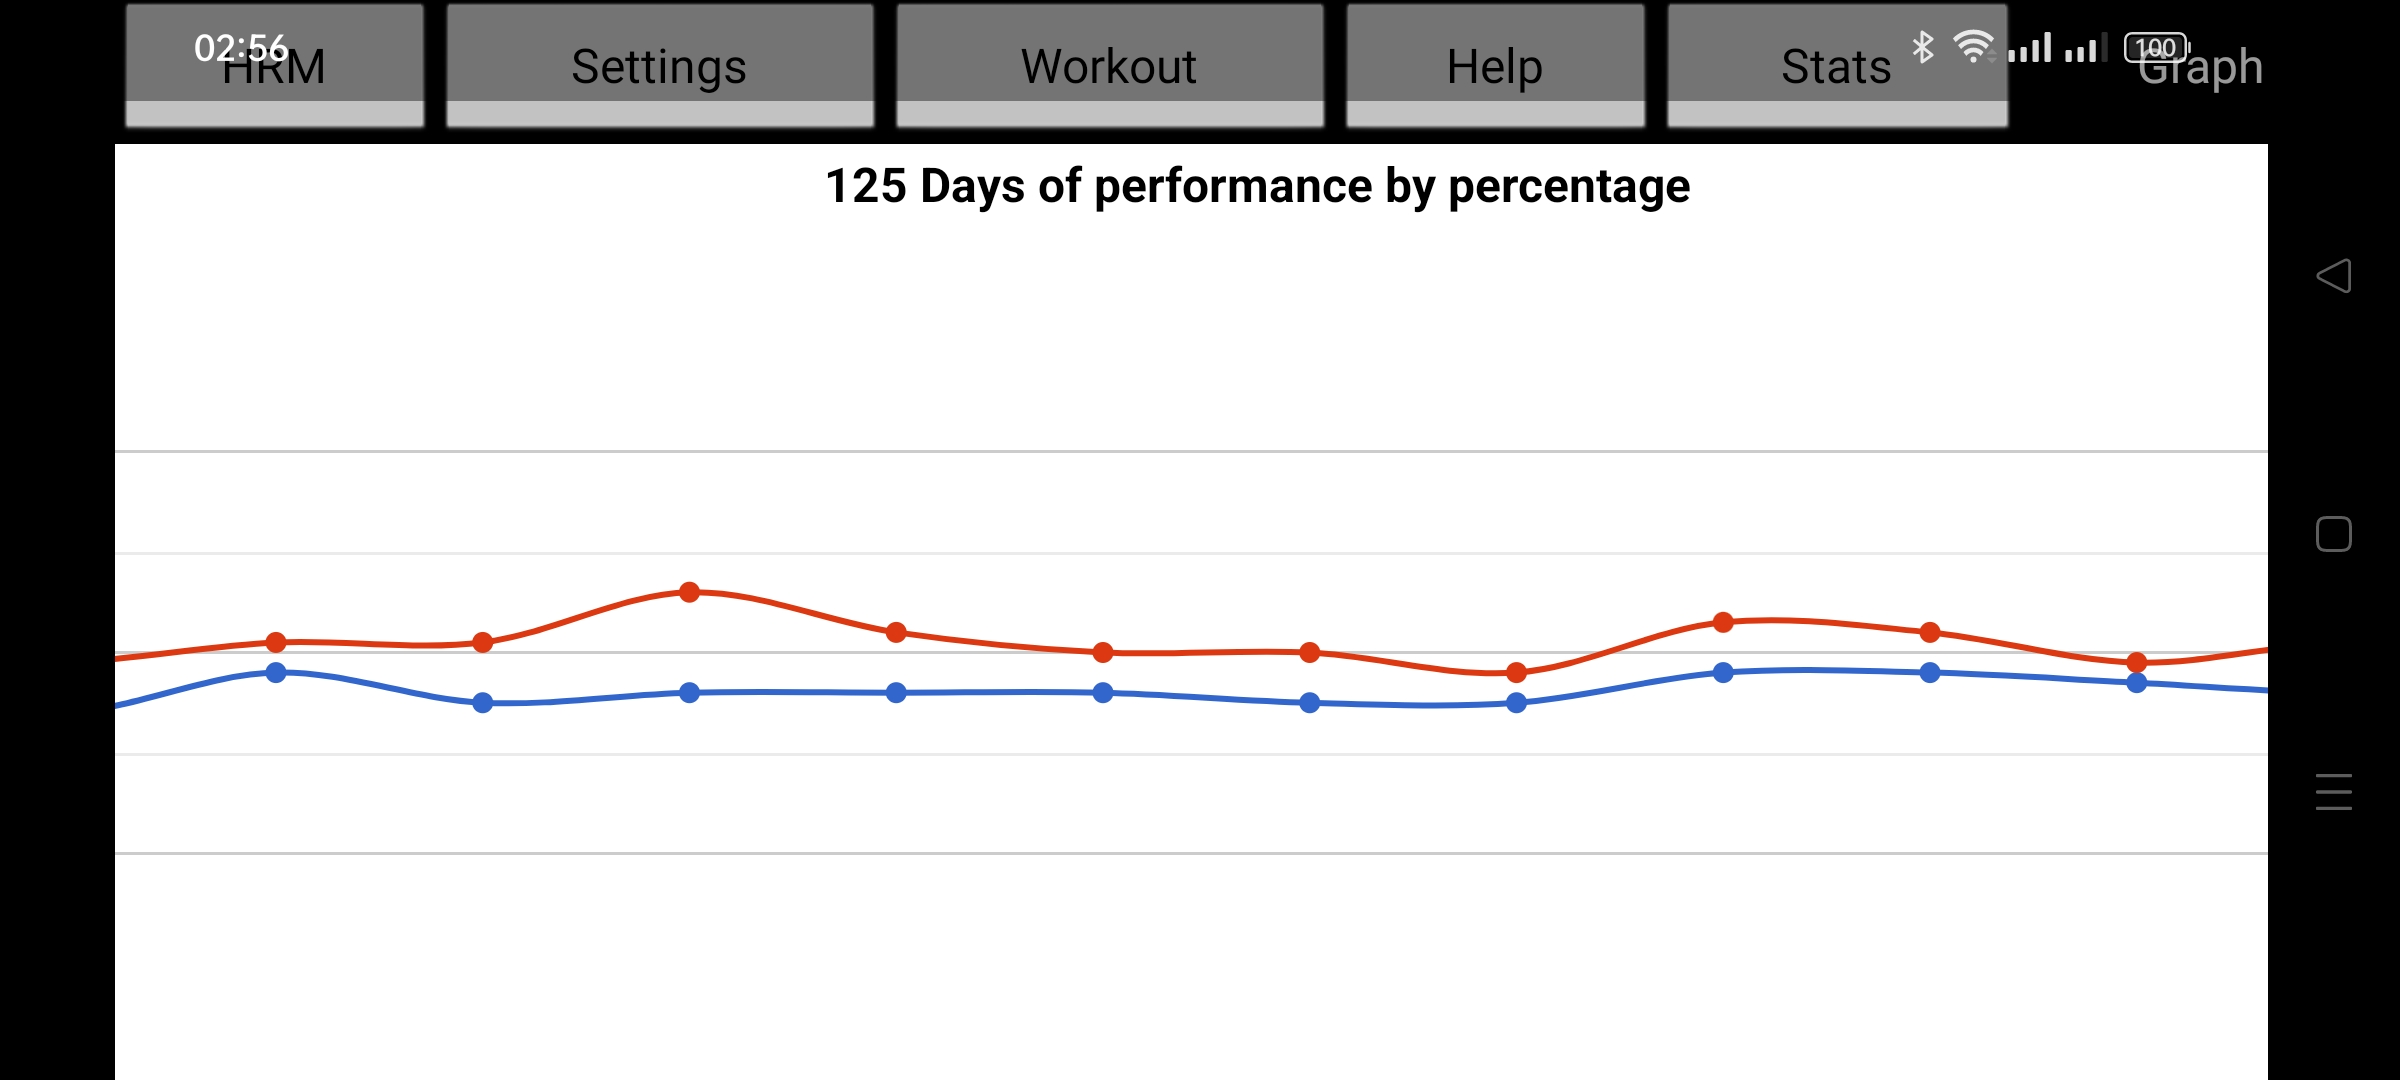
I don't know all the commands for extraOptions but I am hoping to find a way to get something that looks similar to this:
With (full) date along bottom and a persistant scale bar as I scroll
Is this at all possible?
Is there a list of commands that can be sent to extraOptions?