i just found out that the easiest way to create a chart in quickchart.io is to build the url string and bread crumbs from the make_a_dictionary and make_a_list blocks already built-in in appinventor!
it's best to show it by example. this block
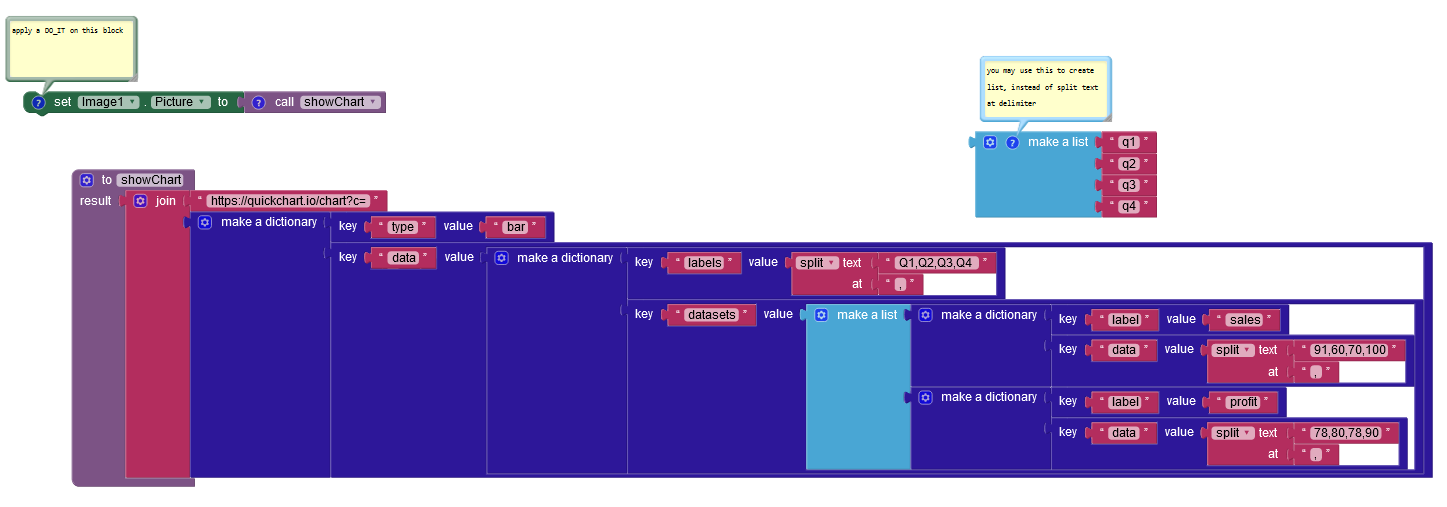
will create this chart;
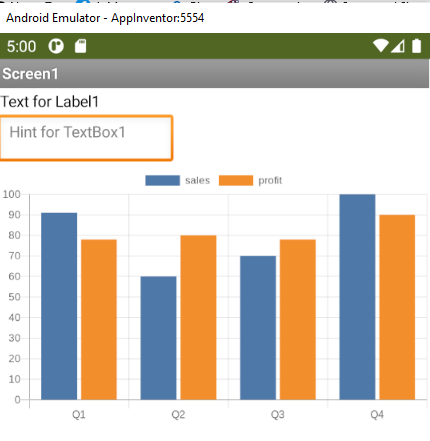
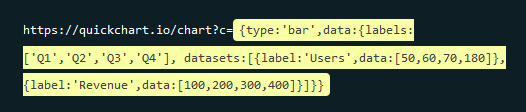
that whole block creates this string:
{"type":"bar","data":{"labels":["Q1","Q2","Q3","Q4"],"datasets":[{"label":"sales","data":["91","60","70","100"]},{"label":"profit","data":["78","80","78","90"]}]}}
which happens to be a json string and it appears like this in a json beautifier.
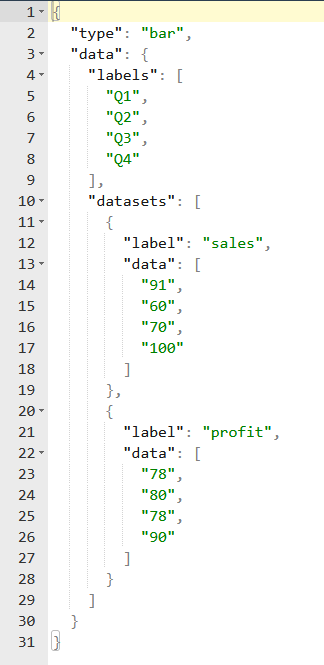
which is the structure required by quickchart when you want to build a bar chart:
try changing the chart type from bar to horizontalBar (note spelling!), or line, or pie!
here is the program:
quickchart(1).aia (3.5 KB)
there is a special case for the bar and horizontalBar charts which is called stacked bars. like this:
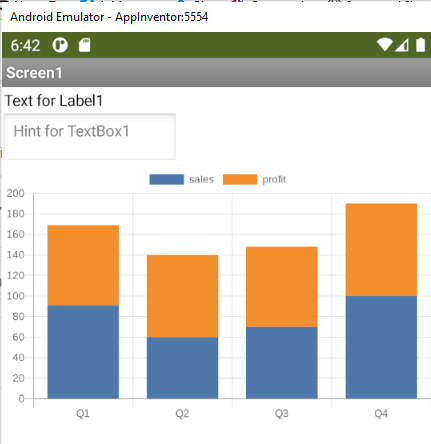
you can achiieve by adding an options block as shown below:
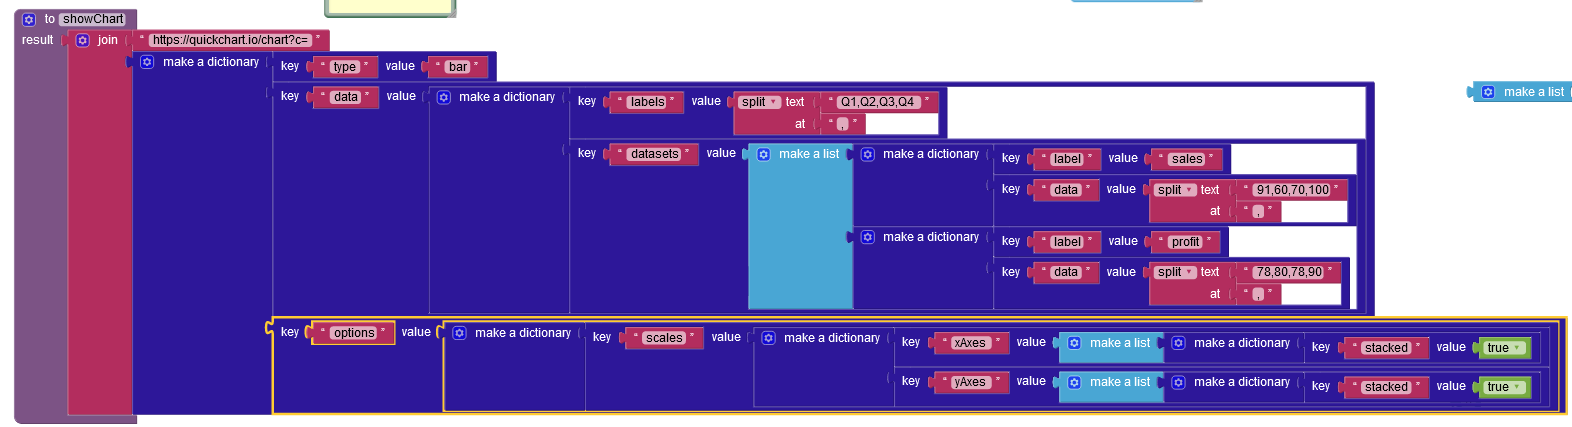
note: use ths option only when you need to show stacked bars.