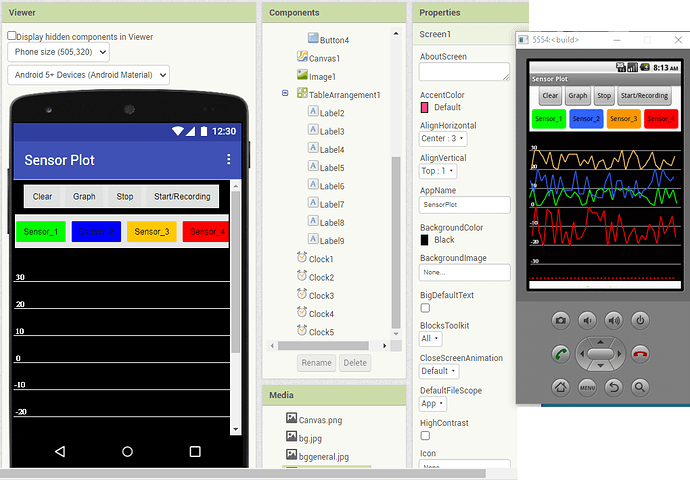
Hello Mr SteveJG
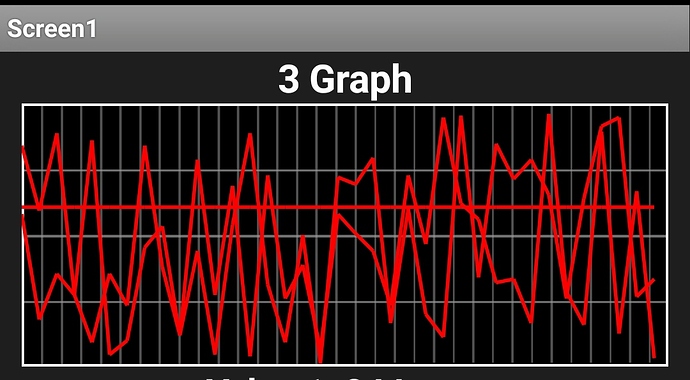
I am trying to create multiple line graphs on a single canvas. I'm trying to recreate your: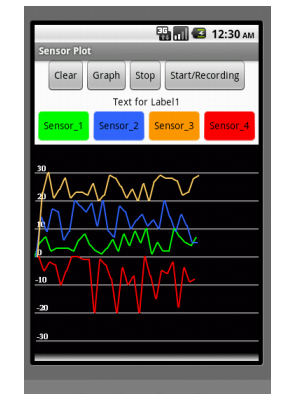 . However, I can't differentiate the graph colors? can you please help me with that?
Do you want to know how to change the graph line color?
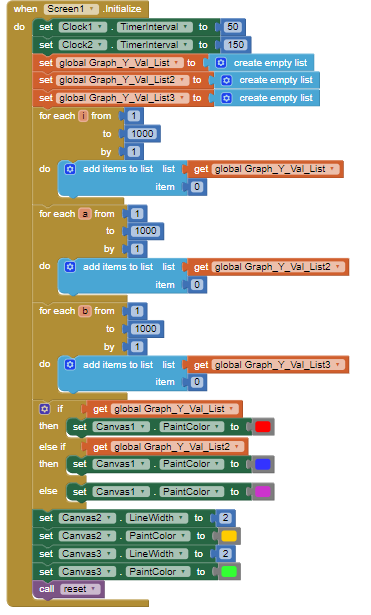
How you change graph plotting colors depends on what you are graphing. I essentially use a conditional statement or another way to determine which sensor to plot and use the appropriate PaintColor to plot. Changing the PaintColor is easy; figuring out which sensor to plot and when can be complex. Here is a simplification if color determination:
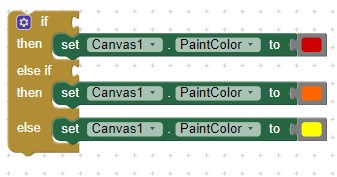
What you need to do in your app depends on what you are plotting and what you have coded so far.
I suggest you use the code shown elsewhere in Trying to create a graph . Use one of the other graphing options; they are easier to implement. 
However, if you are determined and already are plotting multiple curves, just change the paint color of each curve.
Thank you for your reply.
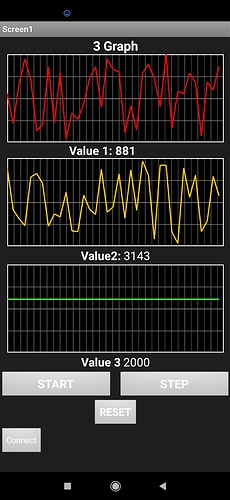
So it will not work on 2 graphs with the same type of inputs? like two random variable graphs?Screenshot_2021-04-06-13-02-42-160_edu.mit.app inventor.aicompanion3|230x500
I manage to make 3 scrolling graphs using the aia codes from the scrolling graph guides.
but when I make it all in one canvas it becomes like this:
is it possible to state each color based on the changing variables?
for example, I'm using the global y value and global y value 2 as the statement.
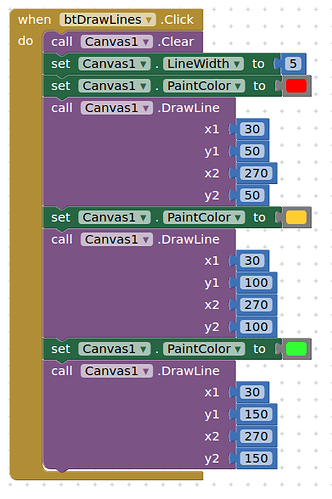
For a single canvas, you need to apply graph changes and colour changes in the correct order. For a basic example see here:
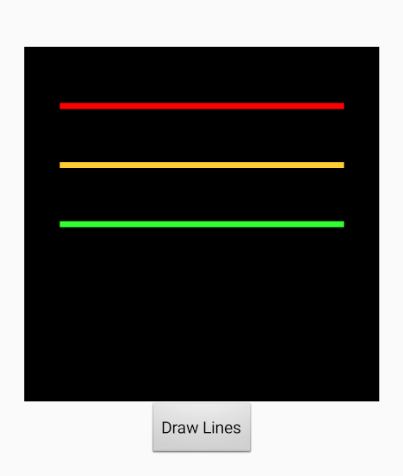
For each iteration of values for each line, you should follow this sequence.
(Leave out the Canvas.Clear!)
My example does work with several inputs using several timers on a single Canvas Daniel. The code is complex. I used a common x and y axis scale and sequenced plotting using four Clock controls.
Tim has what may be a simpler solution.
Did you knew how to draw it??
You can use the native Chart component now for this.
Here is my example mentioned in post #2 and #7.that shows one way to draw multiple line graphs on a single canvas. The example uses 'artificial' real time graph data (which accounts for most of the code Blocks). Adapt this code to graph what you want to graph.
GraphMultipleValues6.aia (19.4 KB)
There are other ways to graph however this example does use the Canvas. ![]()
