Won't you look at this, I've managed to make something happen here, I think it is starting to work.
I have no idea if the list is generated right but it looks like it's working!
I got my code like this now :
Won't you look at this, I've managed to make something happen here, I think it is starting to work.
I have no idea if the list is generated right but it looks like it's working!
I got my code like this now :
I have a problem, currently it only gets the values when I press a button, I tried automating it by moving the call function of reading from the csv when pressing a button to make it by default after the appending is done
and it gives the following error now:

Also, the returned values from the csv have no "," delimiter in-between them.
They are supposed to look like this:
xx,xx
-xx,xx
xx,xx
not like this:
(xx xx)
(-xx xx)
(-xx xx)
etc
A partial solution may be to add the text output to a new variable.... totalData that is a List using the
add items to list totalData
with the item socket set to text
You may have to use a Clock to periodically send totalData to your Label or Chart routine to read the totalData List.
I do not know what happened but I tried switching back to pressing the button in order to make it work again and now it returns the same Runtime Error, also it's like the esp32 doesn't send data anymore.
Edit: well, I had to restart my esp32.
I think it somehow bugged itself after so many connects without disconnects to it (since I don't have a disconnect button at the moment).
Okay so I managed to solve it by simply adding a clock and calling the read function with it and
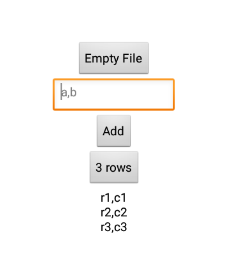
it works but I still ain't sure if this format is good, I wonder why are there these "( )" on each line and why isn't a comma in between the listed values.
Also there is a strange symbol "["] above the button for the list picker. I wonder what that means.
Also, the values aren't getting updated while I am in the list picker. For some reason, they only update once I go back and click on the button again.
Yes, it can read the files only when:
Assigning a table (list of lists) into a .Elements list forces each row into a text value for an Element. The ( ) or is AI2's way of telling you that it was forced to squeeze a list into a text value.
You can avoid this by taking the original CSV table text format datum,datum\ndatum,datum\ndatum,datum through a split at \n block, producing a one dimensional list of text items "datum,datum", "datum,datum", "datum,datum" suitable for assignment into a .Elements list.
Thank you for the tip, where exacly do I need to add the blocks my dear ?
These are the current blocks assigned for the data.csv file
I am currently thinking about giving up on Highcharts implementation since in order to have it work I'd have to know how to inject the data.csv into a .js file in order for Highcharts to read it because it won't work with the $.get command because it's an Ajax request and something among those lines from what I've read it really needs either jQuerry, either an url where the data.csv is being updated and hosted either it needs to have the contents of the data.csv constantly being injected into a .js file and that is over me at the moment, unless someone knows a better method.
I've also went with @SteveJG advice and installed the ChartMaker extension, created the blocks but it renders as blank, perhaps because of the way the csv data is formated.
Here is a basic CSV data collection sample app for you to study,
driven by a text box and an Enter button.
 csv_builder.aia (2.9 KB)
It is impossible to provide advice if you do not expose your entire Block code MelodyApril. I cannot see some of the critical Blocks where you post your RSSI,Distance data in a Label.
You should not have to create a data.csv file and store it using the File component to use ChartMaker.
Your image shows you 'capture' your data pairs (RSSI,Distance) in a Label.
0,2
0,2
-3,2
Are you? If you are sending the data to a Label as I believe you are, I probably have a graphing solution for you that might work .
The example I have in mind requires the data to be in the form Distance,RSSI to get the chart axes populated the example solution . Can you provide the csv data in the Label RSSI,Distance you currently provide?
Thank you.
A guess. Get rid of all the File control Blocks and add your data points to a List of your data pairs
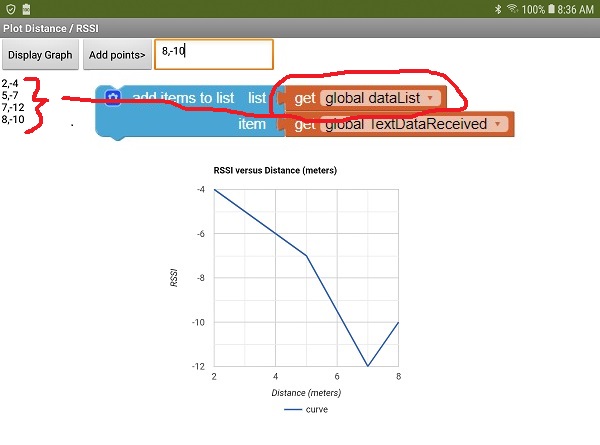
where you write to a List instead of saving the /data.csv file.I can not test your code so I made a 'simulation'

that creates the chart from dataList. I think you can create the dataList from where your earlier device image shows you 'capture' your data pairs (RSSI,Distance) in a Label.
0,2
0,2
-3,2
Bluetooth4Simulation.aia (184.8 KB)
Experiment and see if you can figure the simulation out and apply it to your Project. Good luck.
Doesn't want to work, now it messed up the data received from the esp32 as well I don't receive any data.
Update: Got it to fetch the data from the Esp32 again but the graph still doesn't work
Perhaps 
or
Try moving those two 'green' blocks.
You do not want to use the File component blocks at all if you create a DataList.
Did you get the example 'simulation' to run with dummy data?
Also, please DoIt with the DataList block (anywhere on one of them, right click and select DoIT )
I tried doing what you say, same error comes, also doit does nothing.
there is only one item in your datalist...
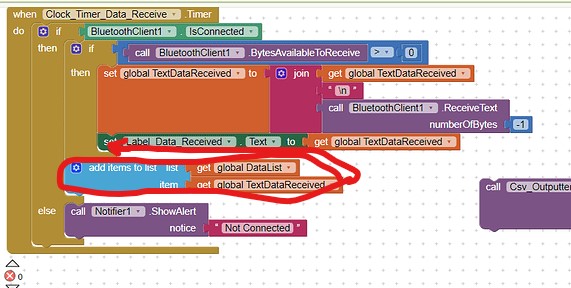
also your add items to list block is wrong...
the list is called DataList
and the item you want to add is TextDataReceived...
Taifun
you might want to provide a screenshot of the latest relevant blocks including Do it result
Taifun